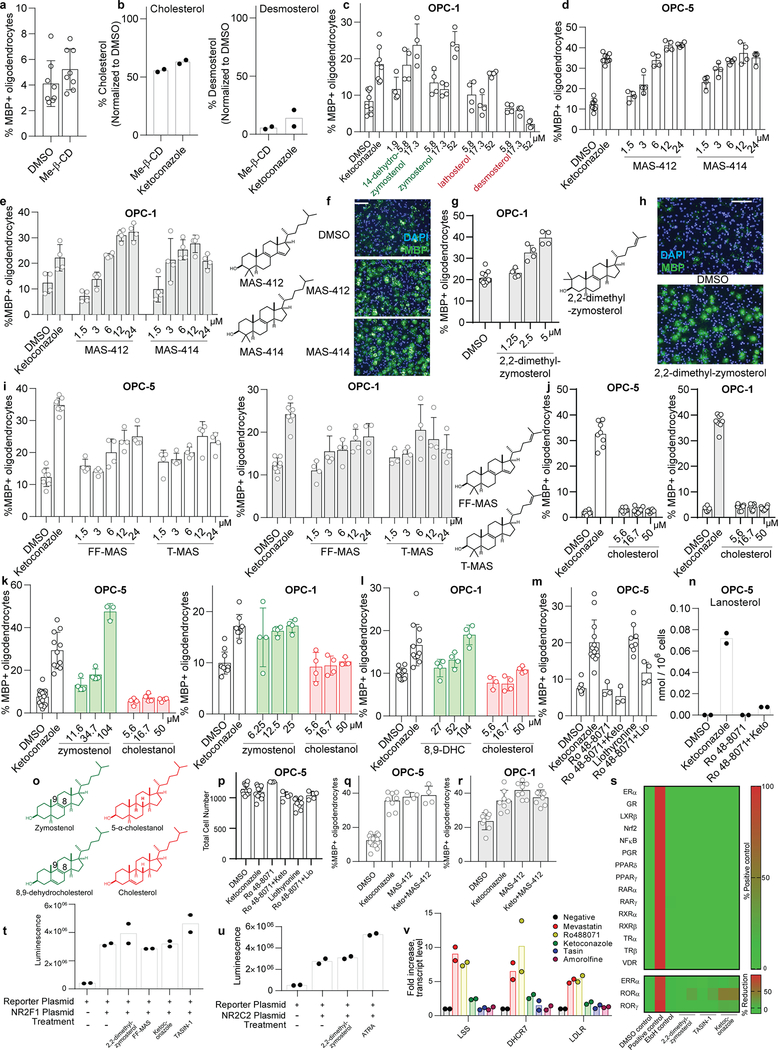
Extended Data Figure 5. Effect of 8,9-unsaturated sterols on oligodendrocyte formation.
a) Percentage of MBP+ oligodendrocytes generated from OPCs (OPC-5) at 72 h following treatment with methyl β-cyclodextrin (1 mM) for 30 min at 37 °C. n = 8 wells per condition, with > 1,000 cells analyzed per well. b) GC/MS-based quantitation of cholesterol (left) and desmosterol (right) levels in OPCs (OPC-5) treated with methyl β-cyclodextrin (Me-β-CD) at 1 mM or ketoconazole at 2.5 μM. n = 2 wells per condition. c, d) Percentage of MBP+ oligodendrocytes generated from OPC-1 (c) and OPC-5 cells (d) at 72 h following treatment with the indicated purified sterol intermediates. n = 4 wells per condition, except n = 8 for DMSO and ketoconazole, with > 1,000 cells analyzed per well. Green text highlights metabolites that accumulate after treatments that enhance oligodendrocyte formation (Fig. 2e, Extended Data Fig. 3c). e) Percentage of MBP+ oligodendrocytes generated from OPC1 at 72 h following treatment with MAS-412 and MAS-414. n = 4 wells per condition, with > 1,000 cells analyzed per well. f) Representative images of OPC5 cells treated 72 h with DMSO, MAS-412, or MAS-414 (3 μM). Nuclei are labeled with DAPI (blue), and oligodendrocytes are indicated by immunostaining for myelin basic protein (green). Scale bar, 100 μm. g) Percentage of MBP+ oligodendrocytes generated from OPC-1 at 72 h following treatment with 2,2-dimethyl-zymosterol. n = 4 wells per condition except DMSO (n = 12), with > 1,000 cells analyzed per well. h) Representative images of OPC-5 cells treated 72 h with vehicle and 2,2-dimethyl-zymosterol (2.5 μM). Nuclei are labeled with DAPI (blue), and oligodendrocytes are indicated by immunostaining for myelin basic protein (green). Scale bar, 100 μm. i) Percentage of MBP+ oligodendrocytes generated from OPC-5 (left) and OPC-1 (right) at 72 h following treatment with FF-MAS or T-MAS. n = 4 wells per condition except DMSO and Ketoconazole (n = 8), with > 1,000 cells analyzed per well. j) Percentage of MBP+ oligodendrocytes generated from OPC-5 and OPC-1 OPCs at 72 h following treatment with the indicated concentrations of cholesterol. n = 8 wells per condition, with > 1,000 cells analyzed per well. k, l) Percentage of MBP+ oligodendrocytes generated from OPC-5 and OPC-1 at 72 h following treatment with the indicated concentrations of sterols that are structurally identical aside from the presence or absence of the 8,9 double bond (structures in panel o). n ≥ 3 wells per condition (see dot plots as replicate values vary by condition), with > 1,000 cells analyzed per well. m) Percentage of MBP+ oligodendrocytes generated from OPCs (OPC-5) at 72 h following treatment with the indicated small molecules or combinations of small molecules (ketoconazole, 2.5 μM; Ro 48–8071, 11 nM; liothyronine, 3 μM). n = 3 wells per condition, except DMSO n = 11, ketoconazole n = 13, liothyronine n = 8 & liothyronine + Ro 48–8071 n = 4, with > 1,000 cells analyzed per well. n) GC/MS-based quantitation of lanosterol levels in OPCs (OPC-5) treated 24 h with the indicated small molecules or combinations of small molecules at concentrations stated in m. n = 2 wells per condition. o) Structures of zymostenol, 8,9-dehydrocholesterol, 5α-cholestanol, and cholesterol. p) Total cell number as measured by counting of DAPI+ nuclei in the experiment presented in panel m. q, r) Percentage of MBP+ oligodendrocytes generated from OPCs (OPC5 and OPC-1) at 72 h following treatment with the indicated small molecules or combinations of small molecules in two independent batches of OPCs (ketoconazole, 2.5 μM; MAS412, 5 μM). In q, n = 16 for DMSO, 8 for Ketoconazole, and 4 for remaining bars. In r, n = 8 wells per condition. s) Luciferase reporter assays were used to assess if 2,2-Dimethylzymosterol (5 μM), Ketoconazole (2.5 μM), and TASIN-1 (250 nM) modulate human ERα, GR, LXRβ, NFkB, NRF2, PGR, PPARδ, PPARγ, RARα, RARγ, RXRα, RXRβ, TRα, TRβ and VDR transcriptional activity in agonist mode and ERRα, RORα and RORγ in inverse-agonist mode. n = 2 wells per condition and n = 3 wells per positive control conditions. t) Effects of sterols (2,2-dimethylzymosterol 5 μM, FF-MAS 10 μM) and small molecules (Ketoconazole 2.5 μM, TASIN-1 100 nM) on the NR2F1-mediated activation of a NGFI-A promoter driven luciferase reporter. n = 2 wells per condition. u) Effects of 2,2-dimethylzymosterol (5 μM) on NR2C2-mediated activation of a NGFI-A promoter driven luciferase reporter in comparison to cells transfected with reporter only, untreated, or treated with a previously reported positive control (all-trans retinoic acid, ATRA, 5 μM). n = 2 wells per condition. v) LSS, DHCR7, LDLR mRNA levels measured by RT-qPCR following 24 h treatment with DMSO, Mevastatin (2.5 μM), Ro 48–8071 (500 nM), Ketoconazole (2.5 μM), TASIN-1 (100 nM), or Amorolfine (100 nM). n = 2 wells. All bar graphs indicate mean +/− standard deviation, and panels a-n, and t-v are representative of two independent experiments.

