
FIGURE 6:
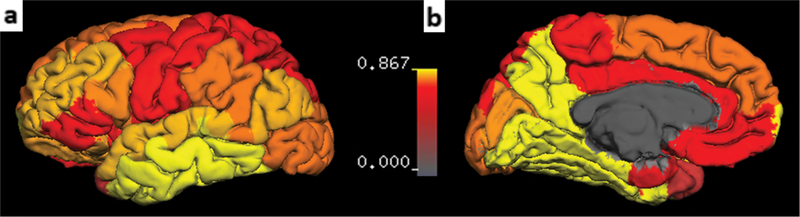
Slopes of linear regressions between ΔR2t* of adjacent subcortical NAWM vs. ΔR2t* of matched cortical NAGM regions (parameter qn in Eq. 6). Data are based on all 44 MS patients. Images represent parameter qn projected on the cortical surface generated by FreeSurfer. Deep GM structures, WM, and ventricles were excluded. Color bar represents qn values.