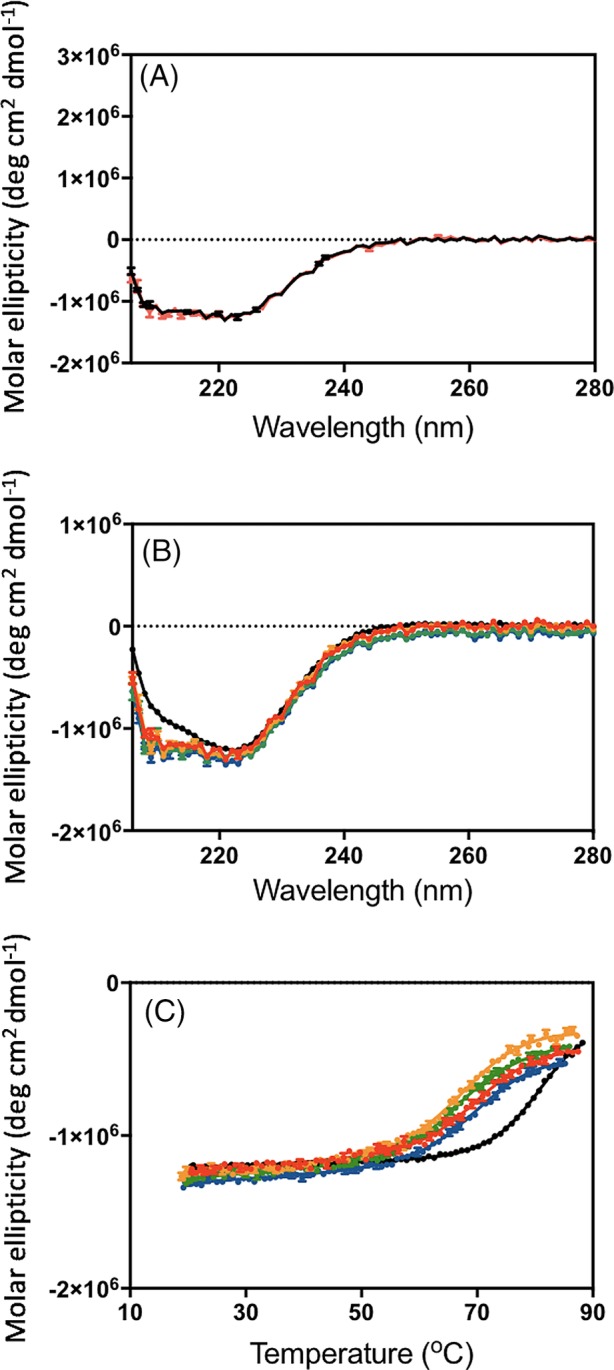
Figure 2.

CD analysis of the Nrf2 CTPR2 proteins. (A) CD spectrum of consensus Nrf2 CTPR2 before (black) and after (red) thermal denaturation. (B) CD spectra of CTPR2 (black), consensus Nrf2 CTPR2 (red), flexible Nrf2 CTPR2 (orange), charge Nrf2 CTPR2 (green) and CIDER Nrf2 CTPR2 (blue). (C) Thermal denaturation curves monitored by CD. CTPR2 (black), consensus Nrf2 CTPR2 (red), flexible Nrf2 CTPR2 (orange), charge Nrf2 CTPR2 (green), and CIDER Nrf2 CTPR2 (blue).
