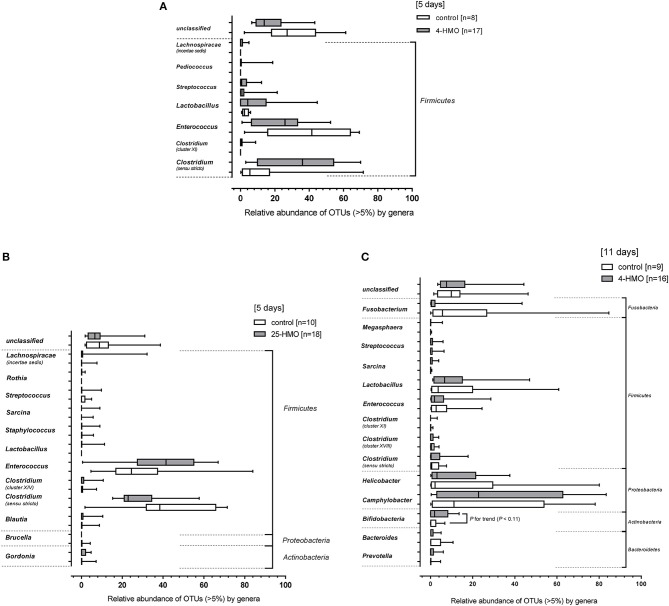
Figure 5.
Relative bacterial abundances of taxa in the colonic microbiota at the genus level. Bacterial genera detected in colon content of pigs from (A) Experiment 1 (4-HMO) for (5 days), (B) Experiment 2 (25-HMO for 5 days), and (C) Experiment 3 (4-HMO) for (11 days). Data from control pigs are shown as white bars and those from pigs receiving HMO blends as gray bars. Data are presented as box plots with median and interquartile range (IQR, 10–90th percentiles). Only phyla with relative abundance >5% were included.

