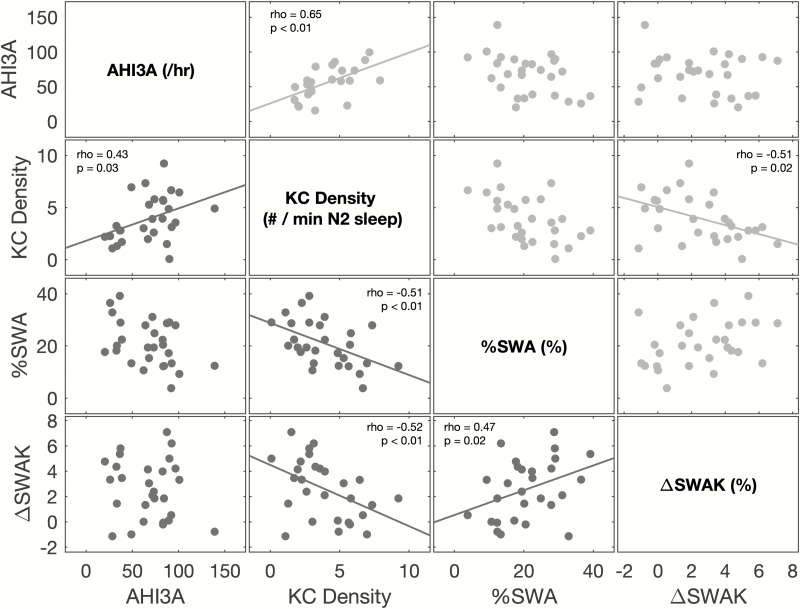
Figure 5.
Associations between OSA severity and EEG slow waves in chronic and acute OSA. Scatterplots above the diagonal (shaded in light gray) represent the associations in acute OSA, whereas scatterplots below the diagonal (shaded in dark gray) represent the associations in chronic OSA. Significant associations, after adjusting for age, sex, and BMI, are shown with a least square fit line, Spearman’s correlation coefficient (rho) and the corresponding p value.

