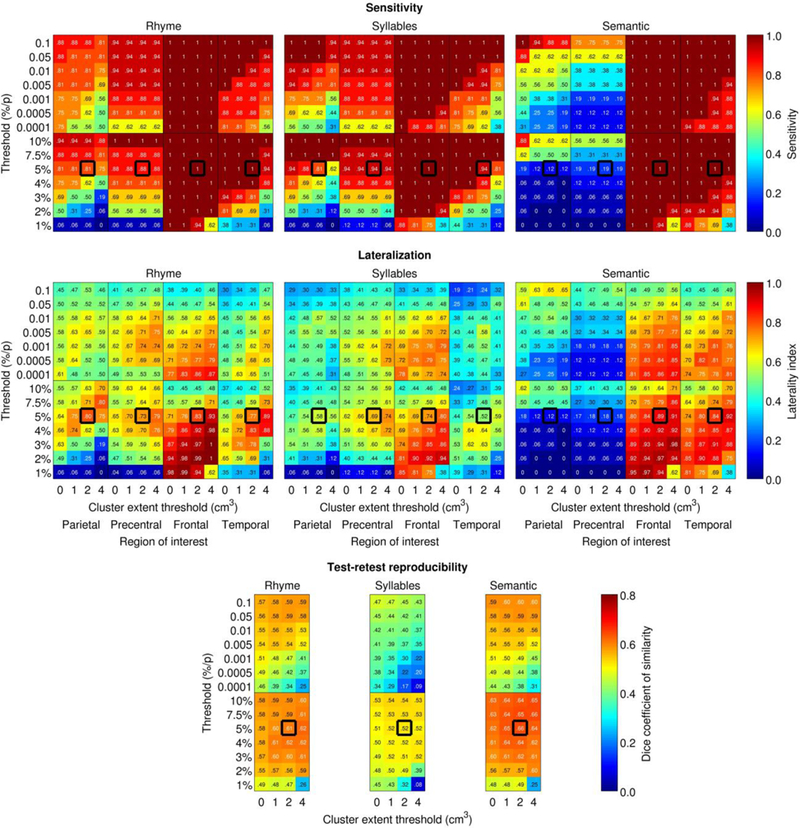
Figure 6.

Impact of analysis parameters on sensitivity, laterality, and reliability. Thick black outlines denote the a priori analysis parameters. Sensitivity for detection, lateralization indices, and Dice coefficients are plotted as a function of absolute and relative voxelwise thresholds (y axes), region of interest (x axes) and minimum cluster volume (x axes). Detection was defined as activation of at least 2,000 mm3 in the relevant ROI.
