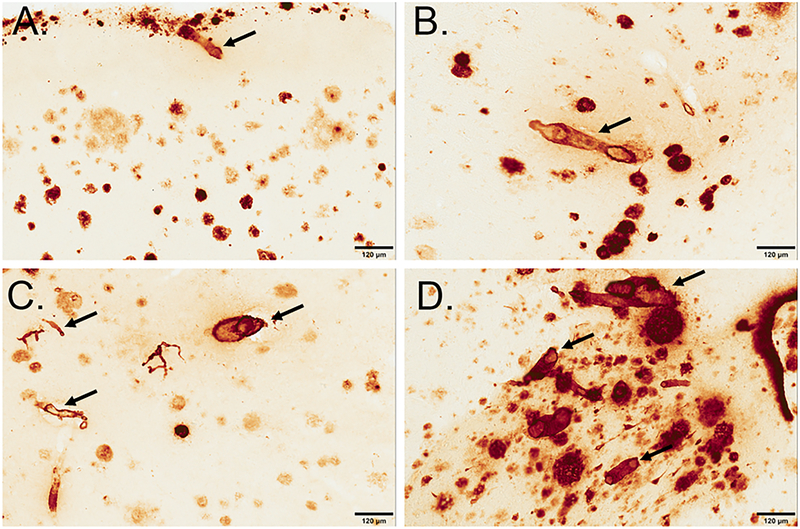
Figure 1: CAA was scored on a scale of 0–4 in the FCTX and OCTX.
, where 0=no deposition (not pictured), 1=scattered segmental deposition of amyloid (B), 2=circumferential deposition in up to 10 vessels (B), 3=widespread, strong, circumferential deposition in up to 75% of vessels (C) 4= deposition in over 75% of region (includes dyshoric changes) (D). Sections are from the frontal cortex and immunostained with anti-Aβ1–40 and arrows indicate CAA pathology in each classification. The scale bar represents 120 µm.

