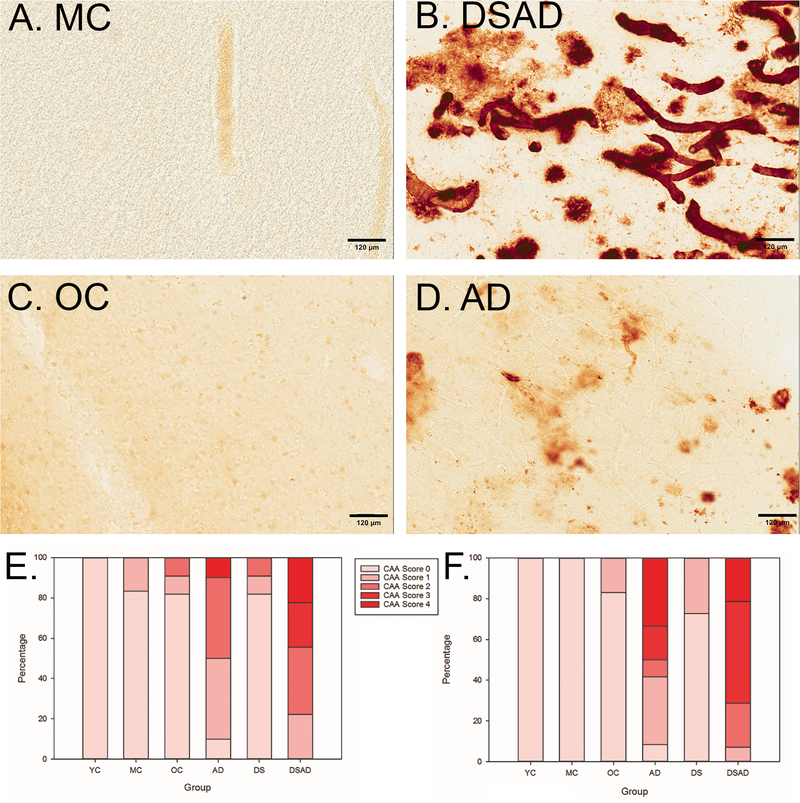
Figure 2: DSAD and AD individuals have more severe CAA than age-matched controls.
(A-D) Aβ1–40 (1:500) immunohistochemistry stain; all images taken at 20x magnification and in the OCTX (A) MC (age=51), (B) DSAD (age=51), (C) OC (age=78), (D) AD (age=78). In the FCTX (E), The DSAD group did not have significantly higher CAA scores than the AD group (p=0.097), all individuals with DS (DS+DSAD) had higher CAA scores than age matched controls. In the OCTX (F), individuals in the DSAD and AD groups had high counts of CAA, although these groups were not significantly different from each other (OR = 9.0, 95% CI 2.3–35.4). Overall, we found that based on an unadjusted ordinal regression model, people with DS across all ages have more severe CAA scores than their age-matched controls in the OCTX (OR=57.5, 95% CI 6.5–509.7). The scale bar represents 120 µm.

