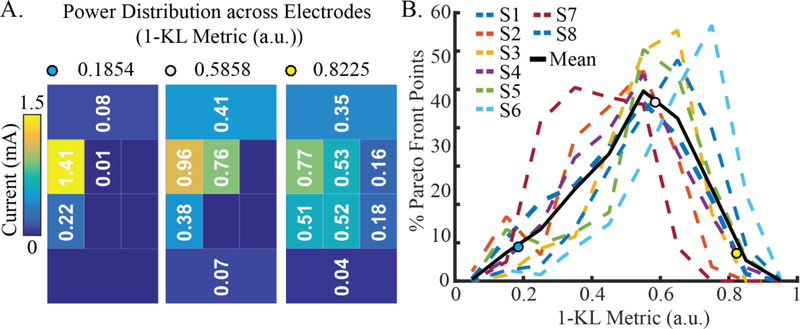
Figure 8:
Distribution of power across active electrodes for each MOPSO-derived electrode configuration on the Pareto fronts across all subjects. (A) Power distributions, as measured by the metric described in Equation 13, reflect higher values for more distributed power (yellow dot) and lower values for less distributed power (blue dot). (B) Across all subjects, the Pareto front points exhibited a range of power distributions, with the majority of configurations consisting of multi-electrode settings.

