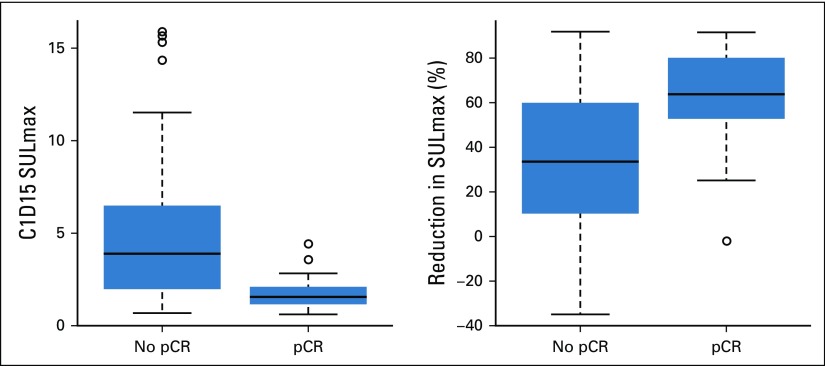
FIG 3.
Box plots of 15 days after pertuzumab and trastuzumab initiation (C1D15) and percent reduction in maximum standardized uptake value corrected for lean body mass (SULmax) in patients with pathologic complete response (pCR) v no pCR. The horizontal line inside each box shows the median. The lower and upper hinges of each box represent the 25th and 75th percentiles, respectively. The circles represent actual values of C1D15 and percent reduction in SULmax.

