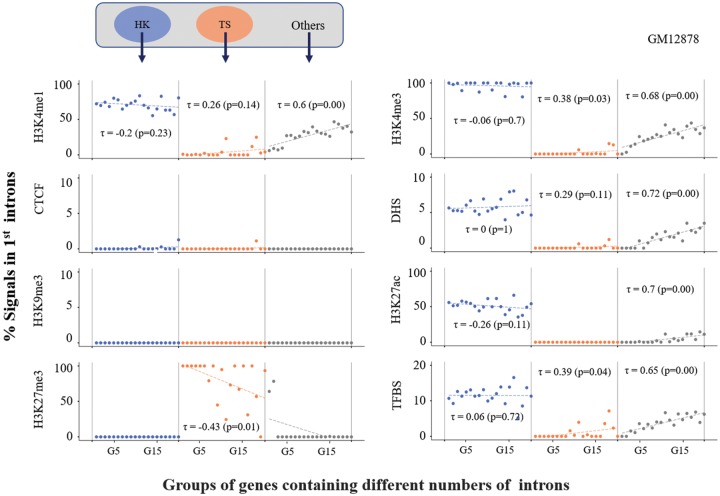
Fig. 3.
—Proportions of epigenetic marks in the first introns of genes classified by the specificity of gene expression. Genes were classified by gene expression specificity as follows: housekeeping (HK) genes, tissue-specific (TS) genes, and “Others” (see Materials and Methods). For each class, we further grouped the genes by the number of introns within them. For instance, genes carrying one intron were grouped in G1 (i.e., genes carrying two exons within the gene structures), and genes with two introns were grouped in G2 (i.e., genes carrying three exons within the gene structures). Using the same epigenetic regulatory marks applied in figure 2, we estimated the proportion of each chromatin mark for each gene group and plotted the value in the graph; a total of up to 20 groups of genes (i.e., from G1 to G20) and the proportion of each epigenetic mark were plotted on the x axis and y axis, respectively. Linear regression analysis was applied for each group, from which Kendall’s τ coefficient was estimated, as shown in each graph.

