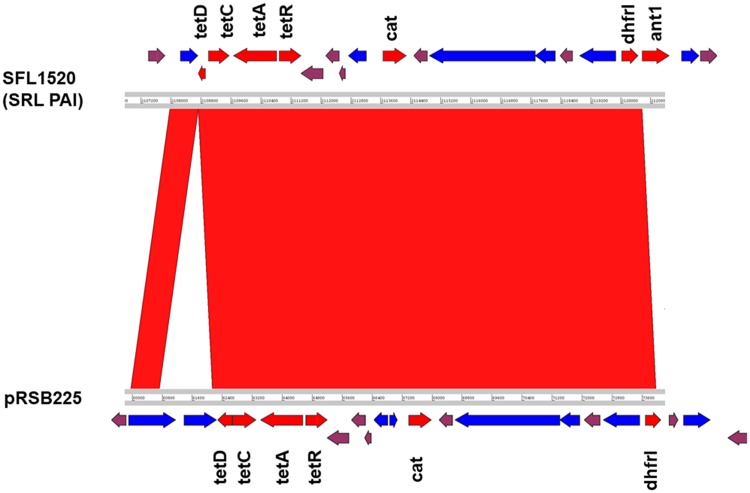
Fig. 5.
—Comparative analysis of SFL1520 SRL PAI with plasmid pRSB225. The compared genomes are depicted as horizontal gray lines with numbers indicating the corresponding genomic positions. The red shadings between the two genomes indicate the collinear synteny of homologous regions. The arrows indicate the open reading frames in the compared genomes: antibiotic resistance genes (red), IS elements/transposases (blue), and plasmid genes (plum). The original sequence of pRSB225 has been reverse complemented for clarity.

