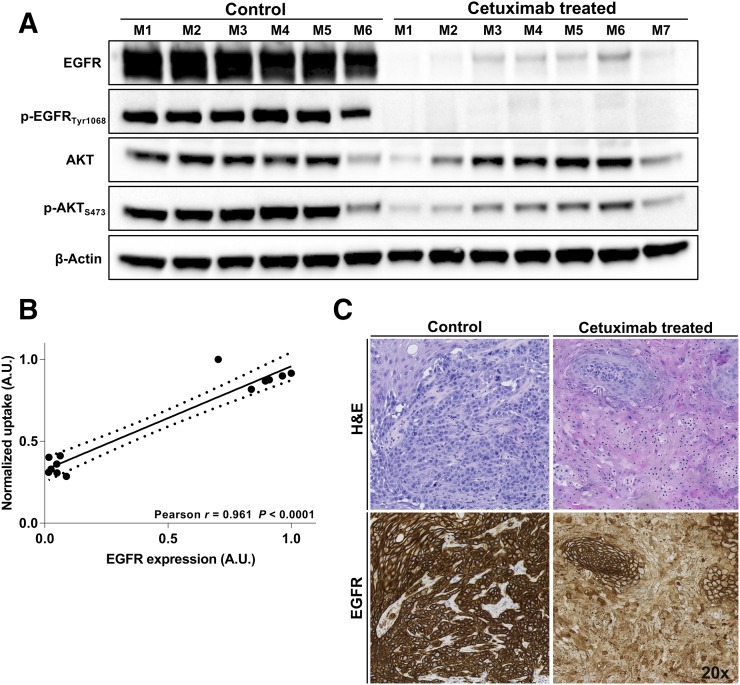
FIGURE 6.
(A) Western blot of tumor tissue lysates from control and cetuximab-treated mice demonstrating EGFR protein expression, activation, and downstream signaling. (B) Spearman rank correlation analysis for EGFR expression as determined by Western blot against 18F-AlF-NOTA-ZEGFR:03115 tumor uptake as quantified by PET image analysis. Dashed lines represent 95% confidence levels. (C) Histopathologic analysis of EGFR expression and hematoxylin and eosin (H&E) staining in HN5 xenografts in both control and cetuximab-treated mouse. A.U. = arbitrary units.

