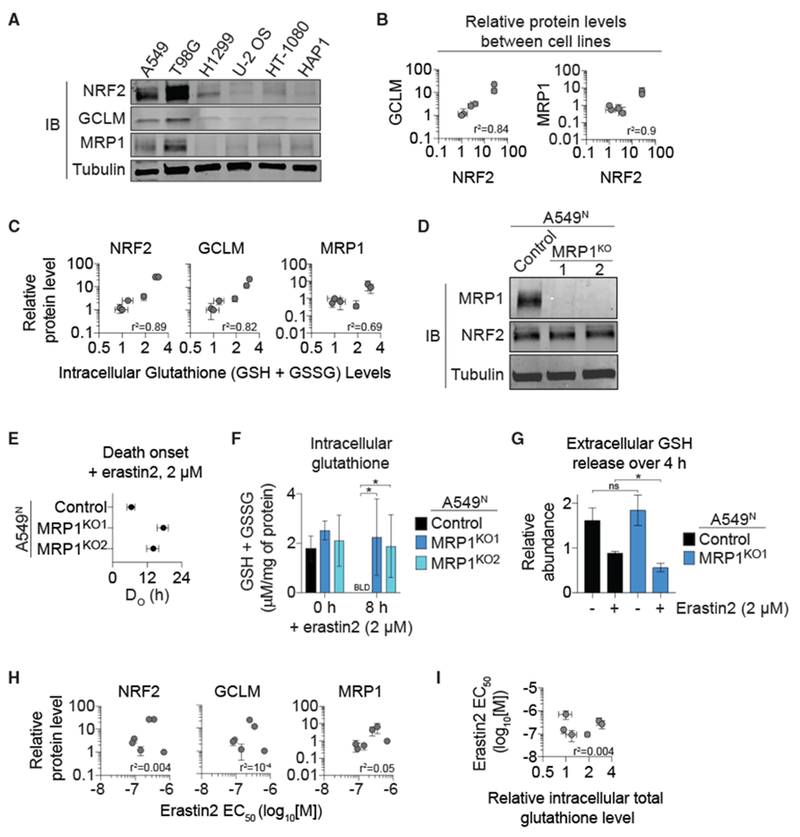
Figure 6. NRF2 and MRP1 Regulate Intracellular Glutathione Levels and Ferroptosis Sensitivity in Distinct Ways.

(A) NRF2, GCLM, and MRP1 protein levels in six cancer cell lines of diverse tissue origin.
(B) Pearson correlation of NRF2 protein levels to GCLM and MRP1 protein levels in the cell lines from (A). Protein expression was determined from three independent experiments and the levels of each protein normalized to those observed in HAP1 cells, which was set equal to 1.
(C) Pearson correlation of NRF2, GCLM, and MRP1 protein expression to intracellular glutathione levels in these cell lines.
(D) Immunoblotting of lysates from A549N Control and MRP1KO1/2 cells using antibodies against MRP1, NRF2, and α-tubulin.
(E) The timing of population cell death onset (DO) determined in A549N Control and MRP1KO1/2 cells using STACK.
(F) Intracellular glutathione levels determined using Ellman’s reagent. BLD, below the limit of detection.
(G) Extracellular GSH release determined by stable isotope tracing and mass spectrometry.
(H) Pearson correlation between NRF2, GCLM, or MRP1 protein levels and erastin2 potency in the six cell lines from (A).
(I) Pearson correlation between erastin2 potency and intracellular glutathione levels in the six cell lines from (A).
Data are means ± 95% confidence intervals (B, C, E, H, and I) or means ± SDs (F and G) from three independent experiments. Data in (F) and (G) were analyzed using one-way ANOVA, with *p < 0.05; ns, not significant.
