
Figure 1.
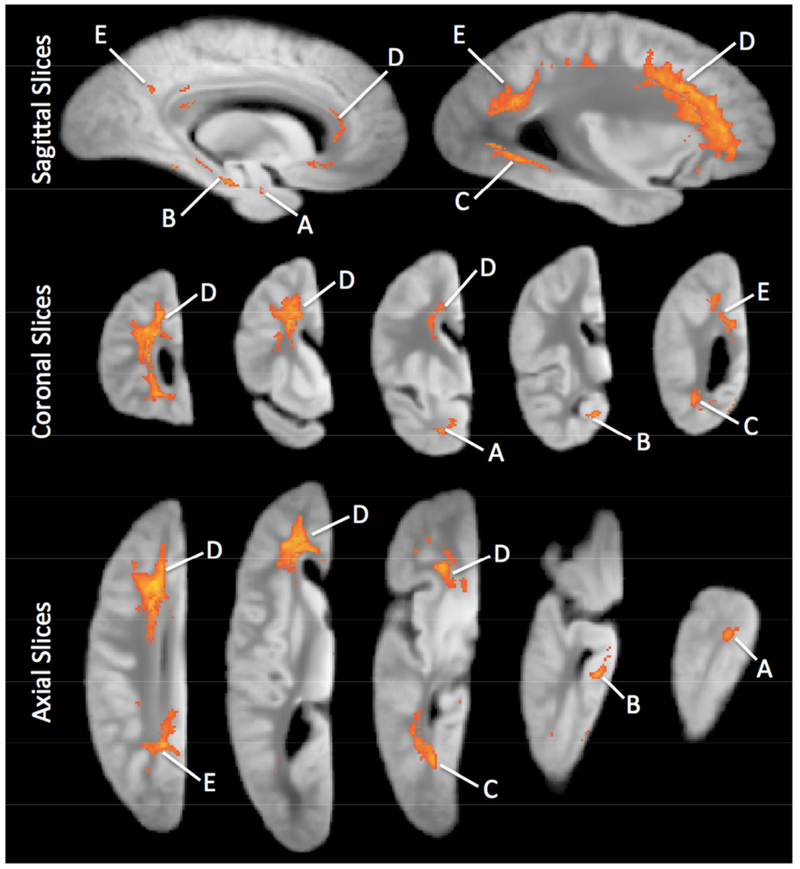
Sagittal, coronal, and axial views of clusters of voxels for which R2 was associated with the estimated slope of decline in global cognitive ability. These images were generated by a voxelwise analysis controlling for demographics, AD pathology , CVD, LBD, HS, TDP-43, and the indices of atherosclerosis, arteriosclerosis, and CAA. The region identifiers A-F correspond to those in Table 3.