
Figure 2.
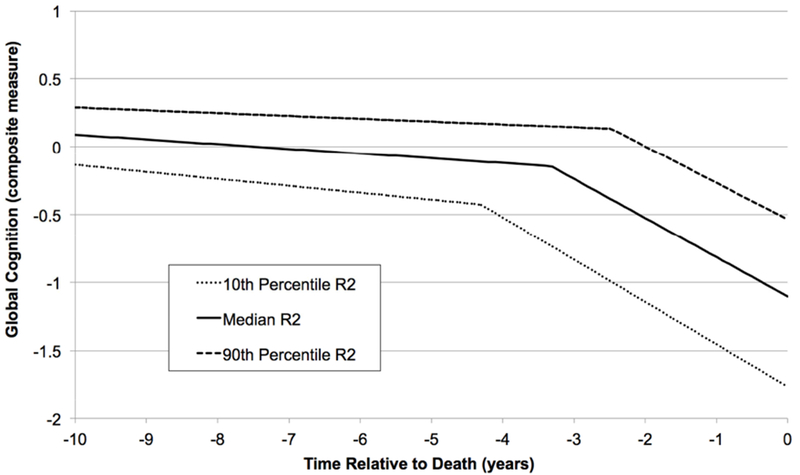
Changepoint trajectories illustrating the association of the composite postmortem R2 measure with a nonlinear model of cognitive decline. The solid line corresponds to the typical decline trajectory for an individual with R2 and AD pathology equal to the sample medians. The dotted and dashed lines represent decline trajectories for individuals with R2 at the 10th and 90th percentiles, respectively. The displayed trajectories also control for age, sex, education, amyloid, tangles, CVD, LBD, HS, TDP-43, atherosclerosis, arteriolosclerosis, and CAA.