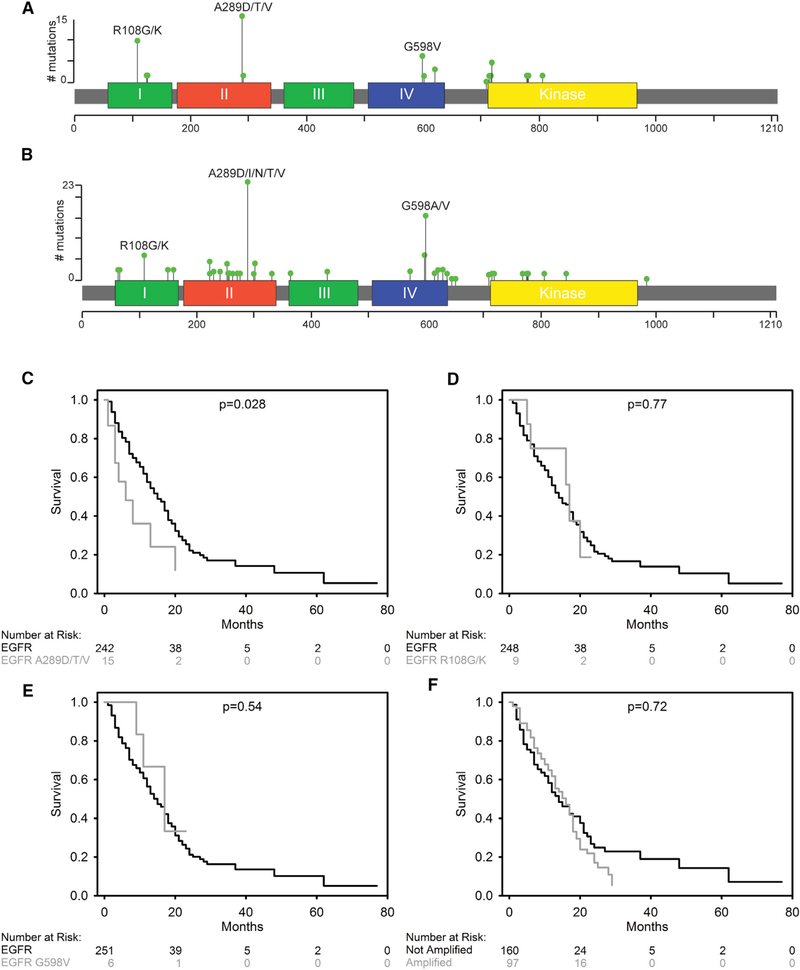
Figure 1. EGFRA289D/T/V Missense Mutations Are Associated with Inferior Survival in GBM.
(A and B) 2D representation of EGFR protein with functional domains indicated by colored segments and summary of missense mutations identified in the UPenn cohort (n = 260) (A) and the TCGA cohort (n = 591) (B). The location of mutated amino acids is indicated by a bar with a green circle. The height of the bar shows the number of patients in each cohort with the specific mutation.
(C–F) Kaplan-Meier (KM) survival curves for the UPenn cohort, comparing EGFRA289D/T/V with EGFRA289 (C), EGFRR108G/K to EGFRR108 (D), EGFRG598V to EGFRG598 (E), and EGFR amplified to non-amplified (F).
See also Figure S1 and Table S1.

