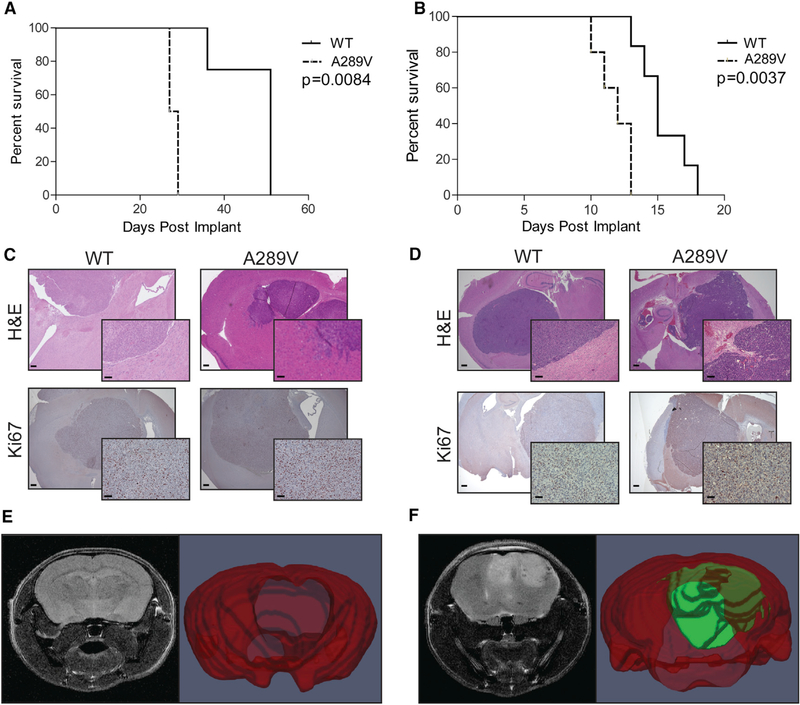
Figure 3. Mice Bearing Intracranial EGFRA289V Tumors Have Attenuated Survival and an Invasive Phenotype.
(A and B) KM survival curves comparing mice implanted with U87 (A) or HK281 (B) tumors expressing either WT EGFR or EGFRA289V, n = 6 per group.
(C and D) Representative H&E and Ki67 stained sections of U87 (C) and HK281 (D) tumors expressing WT EGFR or EGFRA289V harvested at time of sacrifice from mice in (A and B) Scale bars, 100 μm.
(E and F) T2 weighted MRI (left) and 3D volume segmentation map (right) of mouse brains and tumors for WT EGFR (E) and EGFRA289V U87 (F) tumors at 20 days after orthotopically implantation. Whole brain is in red and tumor is in green.
See also Figure S4.

