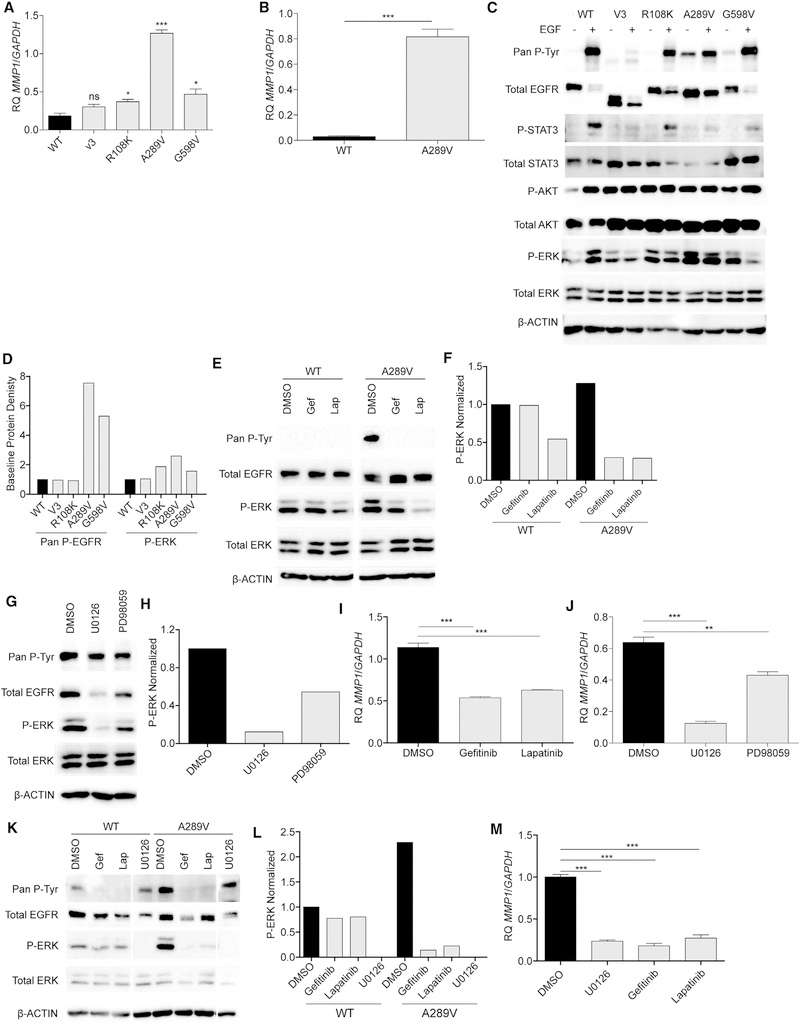
Figure 4. EGFRA289V Missense Mutation Induces ERK Activation and Increased MMP1 Expression.
(A) RT-PCR analysis of MMP1 expression in U87 glioma cells expressing WT EGFR, EGFRvIII (V3), EGFRR108K, EGFRA289V, or EGFRG598V.
(B) RT-PCR analysis of MMP1 in HK281 GBM-spheres expressing WT EGFR or EGFRA289V.
(C) Western blotting analysis of the indicated proteins in serum starved U87 glioma cells expressing WT EGFR, EGFRvIII, EGFRR108K, EGFRA289V, or EGFRG598V in the presence or absence of 100 ng/mL EGF for 10 min at 37°C.
(D) Densitometric quantification of (C).
(E) Western blot analysis of the indicated proteins in U87 glioma cells expressing either WT EGFR or EGFRA289V following treatment with gefitinib (Gef) or lapatinib (Lap) (4 μM, 24 hr).
(F) Densitometric quantification of (E).
(G) Western blot analysis of the indicated proteins in U87 glioma cells expressing either WT EGFR or EGFRA289V following treatment with U0126 or PD98059 (10 μM, 24 hr).
(H) Densitometric quantification of (G).
(I) RT-PCR analysis of MMP1 expression in U87 glioma cells expressing EGFRA289V following treatment with gefitinib or lapatinib (4 μM, 24 hr).
(J) RT-PCR analysis of MMP1 expression in U87 glioma cells expressing EGFRA289V following treatment with U0126 or PD98059 (10 μM, 24 hr).
(K) Western blot analysis of the indicated proteins in HK281 GBM-spheres expressing either WT EGFR or EGFRA289V following treatment with gefitinib (4 μM), lapatinib (4 μM), or U0126 (10 μM) for 24 hr.
(L) Densitometric quantification of (K).
(M) RT-PCR analysis of MMP1 expression in HK281 GBM-spheres expressing EGFRA289V following treatment with gefitinib (4 μM), lapatinib (4 μM), or U0126 (10 μM) for 24 hr. RT-PCR data shown are fold-change gene expression relative to GAPDH. Error bars are SEM of at least three replicates and represent at least three independent experiments.
ns, not significant; *p < 0.05, **p < 0.01, ***p < 0.001. See also Figure S5.

