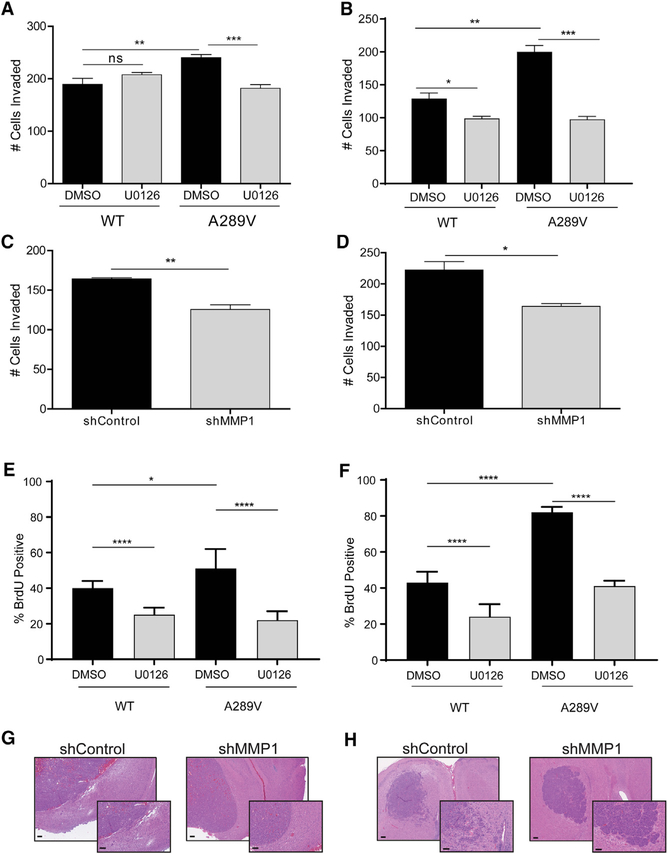
Figure 5. Constitutive EGFRA289V/ERK/MMP1 Signaling Results in Increased Invasion and Proliferation In Vitro.
(A and B) Quantification of U87 glioma cells (A) and HK281 GBM-spheres (B) expressing WT EGFR or EGFRA289V cell invasion following treatment with U0126 (10 μM) or control for 24 hr.
(C and D) Quantification of invaded EGFRA289V U87 glioma cells (C) and HK281 GBM-spheres (D) expressing an shMMP1 vector compared with control shRNA.
(E and F) Quantification of % bromodeoxyuridine (BrdU)-positive U87 (E) or HK281 (F) cells treated with DMSO control or U0126 (10 μM) 24 hr prior to BrdU incorporation.
(G and H) H&E staining of intracranial U87 (G) and HK281 (H) tumors without (shControl) or with MMP1 knockdown (shMMP1). Scale bars, 100 μm. Error bars are SEM of at least three replicates and represent at least three independent experiments. ns, not significant; *p ≤ 0.05, **p ≤ 0.01, ***p ≤ 0.001, ****p ≤ 0.0001.
See also Figure S6.

