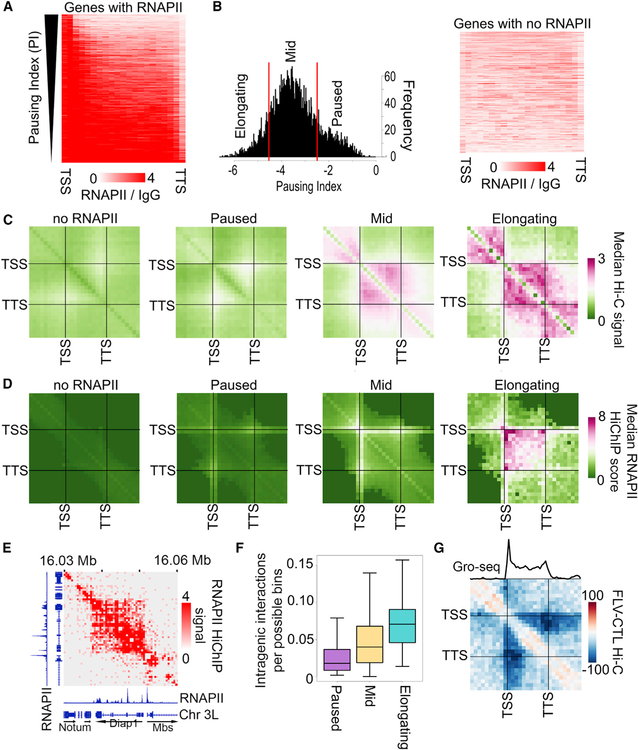
Figure 1. Pausing Index Correlates with Frequency of Intra-genic Interactions.
(A) RNAPII ChIP-seq signal on genes ranked by pausing index.
(B) Left: histogram showing the pausing index cutoffs used to categorize elongating, mid, and paused genes. Right: RNAPII ChIP-seq signal on genes classified as “no RNAPII.”
(C) Metaplot of distance-normalized median Hi-C signal within genes categorized by the pausing index. Interactions within scaled genes as well as that same scaled distance upstream and downstream of the gene are shown.
(D) Metaplot of distance-normalized median RNAPII HiChIP signal within genes categorized by the pausing index. Interactions within scaled genes as well as that same scaled distance upstream and downstream of the gene are shown.
(E) RNAPII HiChIP signal at the elongating Diap1 gene showing intra-genic signal. RNAPII ChIP-seq signal is also shown.
(F) Significant RNAPII HiChIP interactions as a fraction of the total possible bin-to-bin (250-bp) interactions in paused (purple), mid (yellow), or elongating (blue) genes.
(G) Metaplot of differential Hi-C signal for samples treated with flavopiridol (FLV) compared to control (CTL) within elongating genes. Interactions within scaled genes as well as that same scaled distance upstream and downstream of the gene are shown. The average GRO-seq signal is shown above.
See also Figure S1 and Tables S1 and S2.

