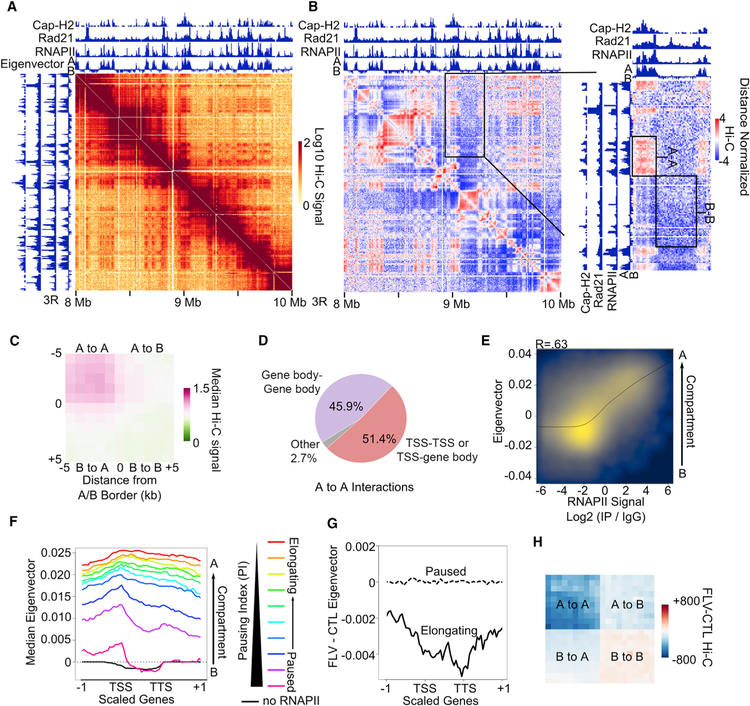
Figure 2. Elongating RNAPII Promotes A-A Compartmental Interactions.
(A) Example locus showing stronger Hi-C signal corresponding to A-A interactions versus B-B interactions.
(B) Knight-Ruiz (KR) normalized Hi-C heatmaps. Left: Hi-C signal normalized by the distance decay. Right: zoomed-in region of A-A and B-B interactions normalized by the distance decay. Tracks of Cap-H2, Rad21, and RNAPII ChIP-seq are shown. The eigenvector at 1-kb resolution depicting A (positive) and B (negative) compartments is also shown.
(C) Metaplot of distance-normalized Hi-C signal in 1-kb bins corresponding to compartmental interactions.
(D) Distribution of significant RNAPII HiChIP interactions where at least one anchor overlaps a TSS (TSS-TSS or TSS-Gene Body) or where both anchors overlap only gene bodies (Gene-Gene Body). Interactions that do not overlap genes on either anchor are shown as Other.
(E) Correlation between RNAPII ChIP-seq signal (x axis) and the eigenvector at 1-kb resolution (y axis). Pearson R = 0.59.
(F) Profiles of the compartmental eigenvector across scaled genes and that same scaled distance upstream and downstream. Genes with no RNAPII (black) and those divided into 10 categories based on the pausing index (rainbow) are shown.
(G) Profiles showing the difference in the compartmental eigenvector obtained from Hi-C after flavopiridol treatment (FLV) compared to the control (CTL) across elongating (solid line) and paused (dashed line) genes categorized in Figure 1A.
(H) Metaplot of differential Hi-C signal for samples treated with flavopiridol (FLV) compared to the control (CTL). Interactions within and between scaled A and B compartments are shown.

