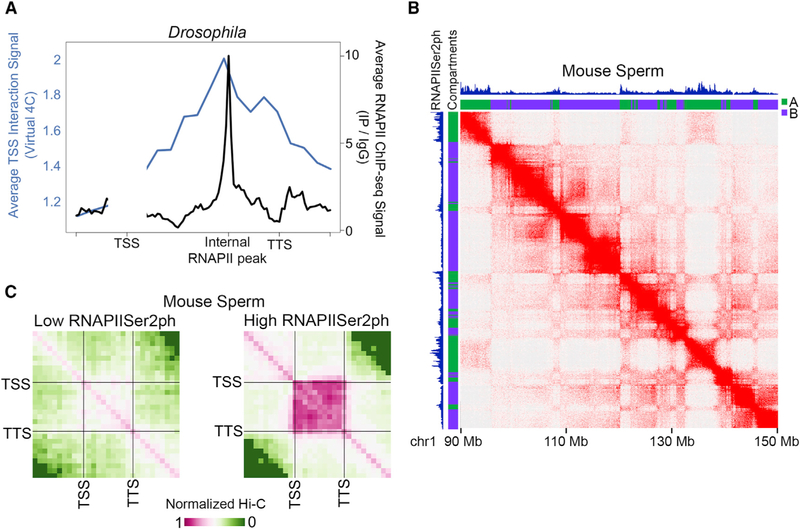
Figure 3. RNAPII versus Transcription Elongation in Chromatin Organization.
(A) Average distance-normalized Hi-C signal between the TSS and gene body (blue), and RNAPII ChIP-seq signal (black), across the gene portion between the TSS, internal RNAPII peak, and the TTS.
(B) Hi-C from mouse sperm showing the overlap of RNAPIISer2ph ChIP-seq signal (top track) and A compartments (green).
(C) Metaplot of distance-normalized average Hi-C signal within genes categorized as having low (left) or high (right) RNAPIISer2ph ChIP-seq signal. See also Figure S3.

