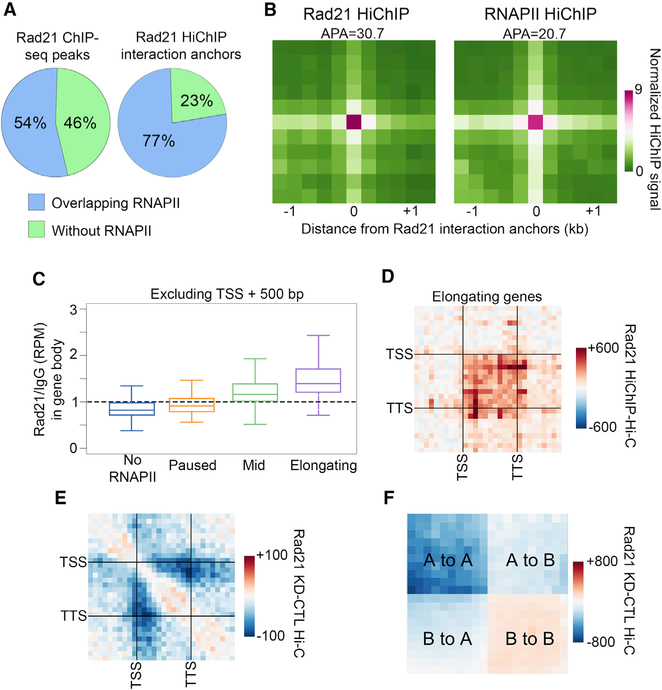
Figure 4. Cohesin Mediates Chromatin Organization in Transcriptionally Active Regions.
(A) Left: percentage of Rad21 ChIP-seq peaks that overlap (blue) or do not overlap (green) with RNAPII peaks. Right: percentage of Rad21 ChIP-seq peaks on significant interaction anchors that overlap (blue) or do not overlap (green) with RNAPII peaks.
(B) Metaplot of HiChIP signal for Rad21 (left) or RNAPII (right) on Rad21 significant interaction anchors. Signal score (APA) is calculated based on Hi-C strength of the center pixel versus the background (a 3 × 3 grid in the top right corner).
(C) Rad21 ChIP-seq signal in the bodies of genes categorized by the pausing index. To exclude TSS signal, only the portion of the gene body between +500 bp and the TTS was considered.
(D) Metaplot showing the difference between Rad21 HiChIP and Hi-C signals in elongating genes. Interactions within scaled genes as well as within that same scaled distance upstream and downstream of the gene are shown.
(E) Metaplot of differential Hi-C signal for samples after depletion of Rad21 (Rad21 KD) compared to the control (CTL) in elongating genes. Interactions within scaled genes as well as within that same scaled distance upstream and downstream of the gene are shown.
(F) Metaplot of differential Hi-C signal for samples after depletion of Rad21 (Rad21 KD) compared to the control (CTL). Interactions within and between scaled A and B compartments are shown.

