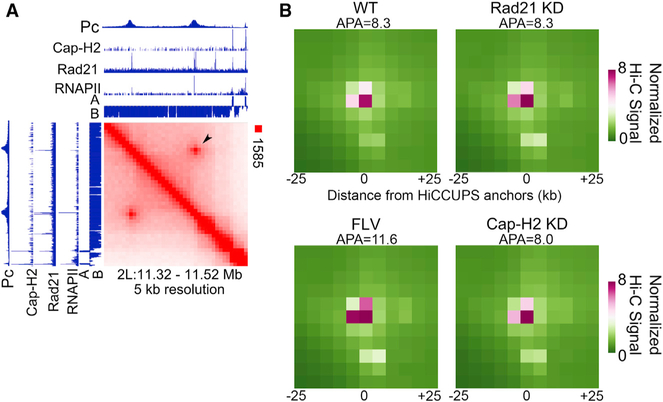
Figure 6. Pc Loops Are Independent of Transcription, Cohesin, and Condensin II.
(A) Hi-C heatmap showing a strong loop identified using Hi-C computational unbiased peak search (HiCCUPS; arrowhead). Cap-H2, Rad21, RNAPII, and Pc ChIP-seq tracks are shown. The eigenvector showing A and B compartmental domains is also shown.
(B) Metaplot of Hi-C signal in control WT compared to Rad21 knockdown (Rad21 KD), cells treated with flavopiridol (FLV), and Cap-H2 knockdown (Cap-H2 KD). Signal score (APA) is calculated based on Hi-C strength of the center pixel versus the background (a 3 × 3 grid in the top right corner).

