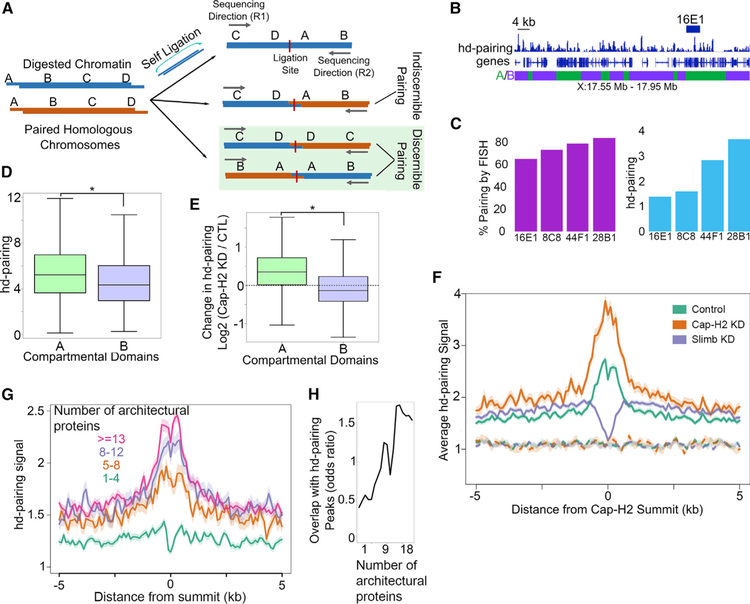
Figure 7. Homolog Pairing Occurs at Small Discrete Loci Enriched in Architectural Proteins.
(A) Schematic outline of different types of Hi-C reads and identification of those that detect interactions between homologous chromosomes.
(B) Example showing the hd-pairing profile around the 16E1 locus, which has also been studied by FISH to identify pairing regions. A and B compartmental domains are denoted by green and purple boxes, respectively.
(C) Pairing signal in cytogenetic bands 8C8, 16E1, and 28B1 as detected by FISH (Williams et al., 2007) (green) compared to hd-pairing detected by Hi-C (blue).
(D) hd-pairing signal in A (green) compared to B (purple) compartmental domains. *p < 0.01, Wilcoxon rank sum test.
(E) Effects of Cap-H2 depletion (Cap-H2 KD) on pairing in A (green) or B (purple) compartmental domains. *p < 0.01, Wilcoxon rank sum test. Dashed line indicates zero, that is, no change.
(F) Profile of hd-pairing at Cap-H2 peaks (solid lines) or random sites (dashes) in the control (teal), after depletion of Cap-H2 (orange), or depletion of Slimb (purple).
(G) Profile of hd-pairing at architectural protein binding sites (APBSs) containing different numbers of proteins (1–4, blue; 5–8, orange; 8–12, purple; R13, red).
(H) Odds ratio of hd-pairing peaks (y axis) overlapping APBSs occupied by different numbers of architectural proteins (x axis). See also Figure S6.

