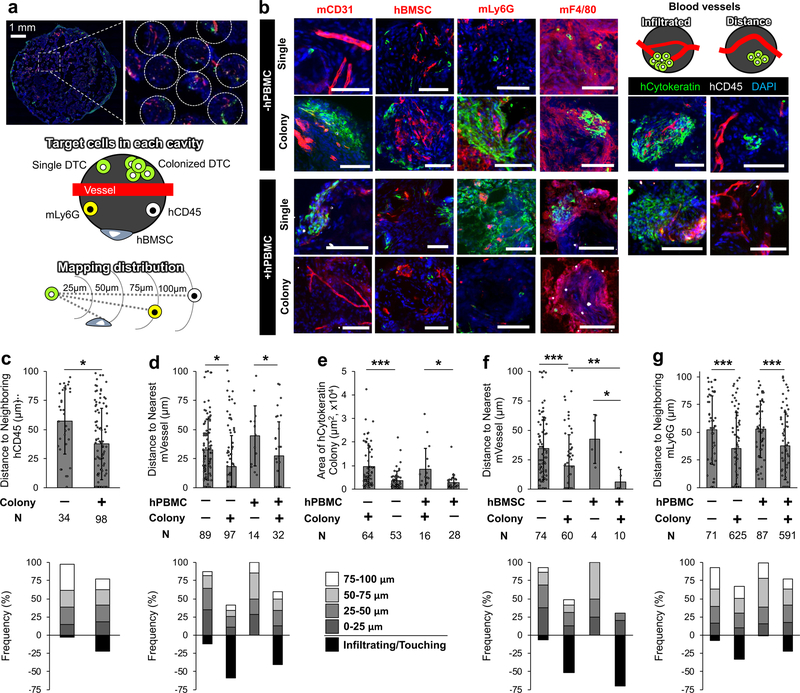
Fig. 6. Quantitative comparison of vascular, stromal and immune niches between single and colonized DTCs in single pore microenvironment.
a-b, (a) Representative images of dormant human DTC bearing scaffold and schematics of pore imaging targets and mapping interpore cellular distribution. (b) Representative IHS of microenvironments surrounding single and colonized DTCs with vascular and cellular niche components including hCD45, hBMSCs, mLy6G, and mF4/80 from 2 independent experiments. Scale bars 100 µm. c, Comparison of distribution profiles of neighboring hCD45+ cells to hTumor cells between single and colonized DTCs (top) and frequency mapping of hCD45+ cells (bottom). d, Comparison of distribution profiles of nearest mCD31+ cells to hTumor cells with and without hPBMC injection (top) and frequency mapping of mCD31+ cells (bottom). e, Comparison of tumor colony size with and without infiltrating mVessel. f, Comparison of distribution profiles of mCD31+ cells to hTumor with and without neighboring hBMSCs (top) and frequency mapping of mCD31+ cells (bottom). g, Comparison of distribution profiles of neighboring mLy6G+ cells to hTumor cells with and without hPBMCs (top) and frequency mapping of mLy6G+ cells (bottom). Representative values were plotted, selected by ordering datasets and averaging every 10 points, when N>100. Data collected from 5 biologically independent scaffolds from each group. Data are mean ± s.d. *P<0.05, **P<0.005 and ***P<0.0005 via two-sided student t-test.

