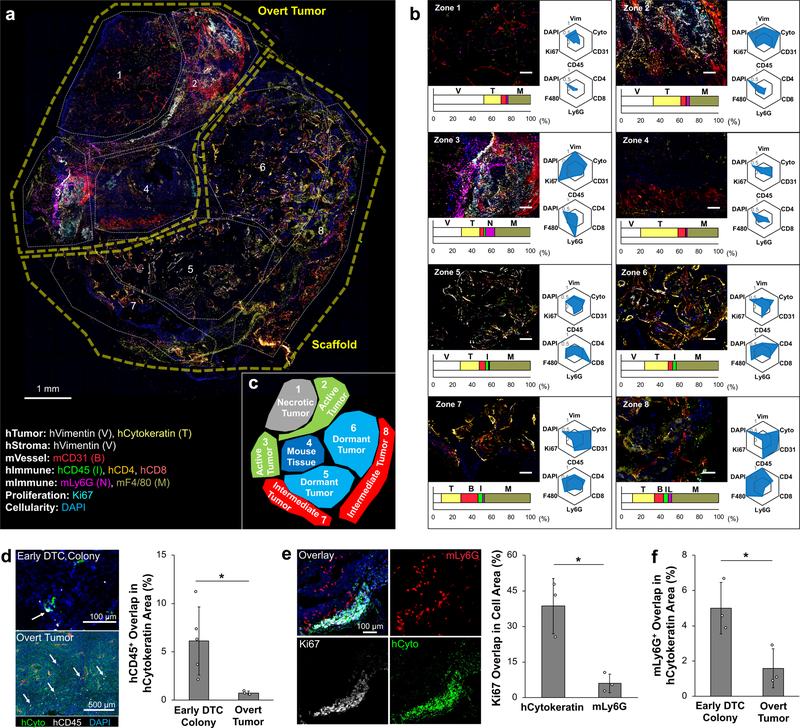
Fig. 7. Multiplex IHS imaging-based characterization of heterogeneity in overt metastatic microenvironments.
a, Overlaid IHS images from eight consecutive 20 µm thick slices and manually defined zones representing distinct microenvironment profiles with a list of antibodies and their associated targets. b, Representative IHS images of each zone with quantitative cellular complexity. Bar graphs display intra-zone composition of quantified antibody staining. Radial plots represent inter-zone comparison of cellular markers normalized to the zone with the highest signal. Top panel highlights human stromal, tumor, and immune cell localization. Bottom panel highlights human and mouse immune cell subset. Three independently formed overt metastatic scaffolds were characterized by multiplex IHS. c, Five functional zones capturing different states of metastatic tumors: (1) necrotic tumor, (2) active tumor, (3) host tissue, (4) dormant tumor, and (5) intermediate tumor. d, IHS images of hCD45 cells found within early DTC colonies (n=5, independent scaffolds) and overt scaffold metastases (n=3, independent scaffolds) with quantitative representation of overlapping hCD45+ cell coverage. Arrows show infiltrating hCD45+ cells (white). e, IHS image of mLy6G+ cell localization at the boundary of an actively growing overt metastasis and quantitative comparison of Ki67 stain overlap with human tumor and mLy6G+ cells (n=3, independent scaffolds per group). f, Quantitative comparison of overlapping mLy6G+ cells in early DTCs and overt scaffold metastases (n=3, independent scaffolds per group). Data are mean ± s.d. * P<0.05 via two-sided student t-test.

