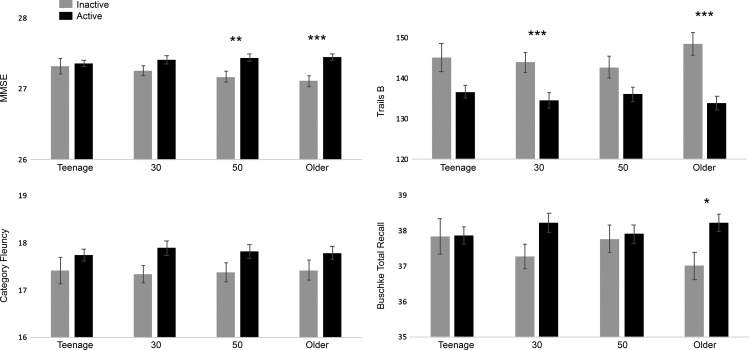
Figure 1.
Cognitive function by physical activity at different age periods. Cognitive function scores (adjusted for age, sex and education) for participants classified as physically active (black bars) or inactive (grey bars) at teenage, age 30, age 50 and older age (mean = 75 years). Note that for Trails B higher scores reflect poorer performance. *P < 0.05, **P < 0.01, ***P < 0.001 for active versus inactive.

