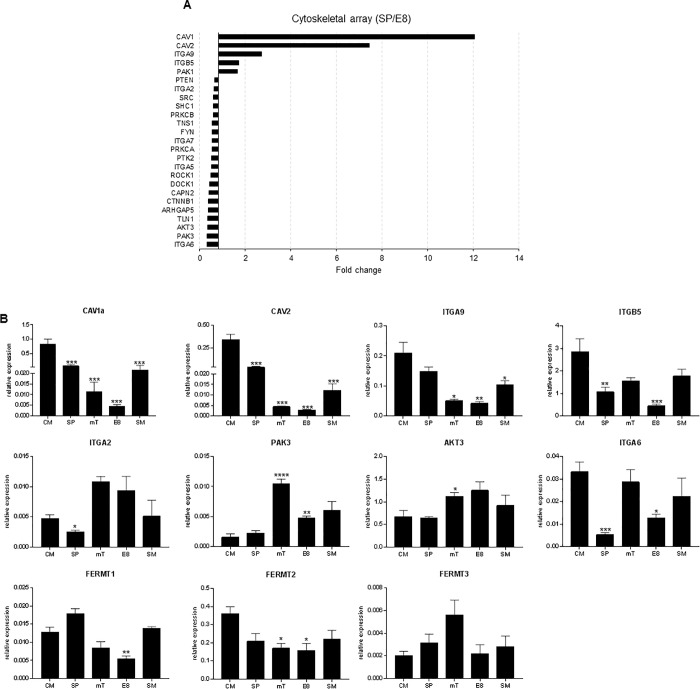
Fig 3. Transcript expression of pluripotency and cytoskeletal for MEL1.
(A) Data from RT2 profiler array demonstrating fold change of cytoskeletal genes, up and down regulated over 1.5 fold between SP and E8 (p < 0.05), the majority of genes were up regulated in E8 as compared to SP media for MEL1 (n = 3 independent experiments). (B) RT-PCR validation of selected cytoskeletal genes for 5 hESC medias in MEL1. Data presented as mean ± SD, n = 3 independent experiments. Statistical analysis from multiple t-tests are shown on graphs between CM and all other medias (* p < 0.05; **p < 0.01; ***p < 0.005; **** p < 0.001); statistics for all other parameters can be found in S3 Table.

