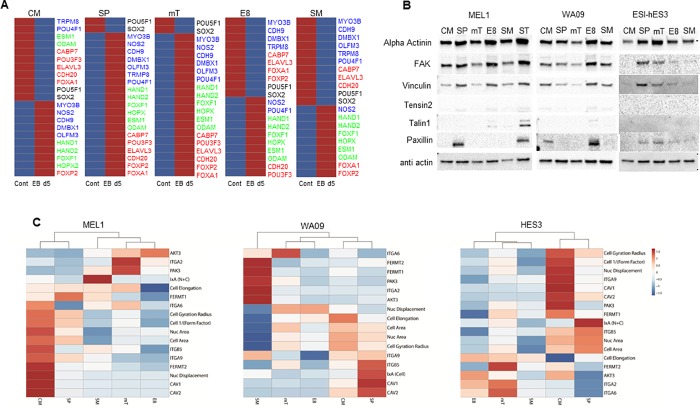
Fig 4. Analysis of protein expression of cytoskeletal markers and differentiation potential of MEL1 cultured in different medias.
(A) Differentiation potential of d5 EB in different medias, data suggests SP and mT media have multilineage potential, with CM, E8 and SM showing a more restricted potential. Red bars show upregulated and blue down regulated gene expression as compared to undifferentiated hESC. (B) Western blots showing protein expression of cytoskeletal markers in different medias. (C) Heatmaps of all three hESC lines using morphological parameters and genes utilised for media validation to establish if medias cluster together. For all medias, CM and SP were most similar. Data presented from 3 independent experiments.

