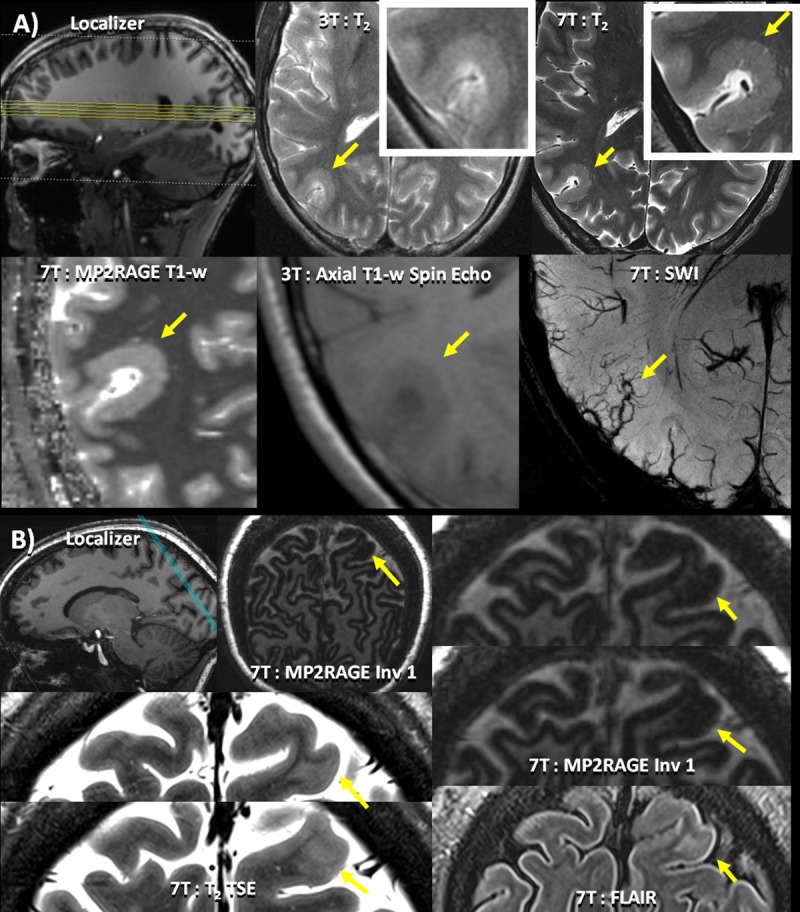
Fig 2. Cortical Abnormalities.

(A) Patient 7 –clockwise from top left: Localizer image showing the location of the axial slices; 3T T2 axial image of the lesion illustrating subtle changes in cortical thickness detected only after the lesion was identified at 7T; 7T T2 TSE slice visualizing the polymicrogyria marked by a yellow arrow highlighting the texture of the polymicrogyria; 7T: MP2RAGE with T1 weighted reconstruction highlighting the abnormal thickening of the cortex due to the polymicrogyria; 3T T1-w spin-echo of the same region; 7T SWI axial slice showing abnormal vasculature due to the polymicrogyria (B) Patient 36 –clockwise from top left: Localizer image showing the location of the axial slices; MP2RAGE full coronal-oblique slice showing cortical dysplasia (yellow arrow) in the left parietal lobe; enlarged slices of 7T MP2RAGE image showing cortical dysplasia marked by a yellow arrow in the left parietal lobe; 7T FLAIR slice showing the location of the cortical dysplasia (yellow arrow) enlarged slices of 7T T2 TSE image showing cortical dysplasia (yellow arrow) in the left parietal lobe.
