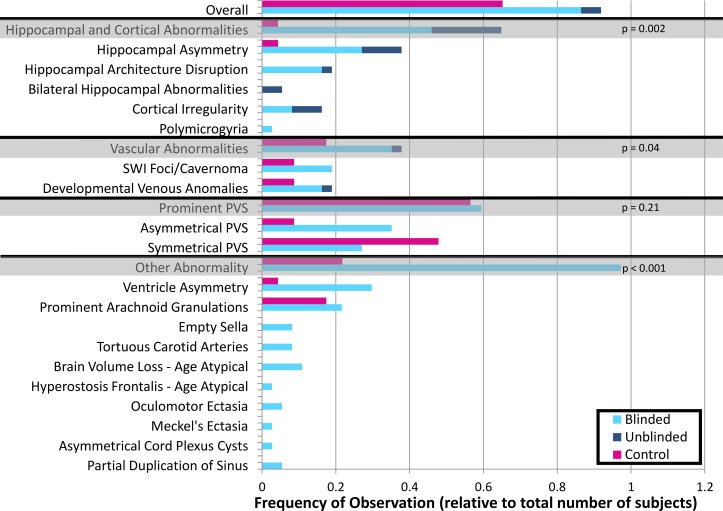
Fig 4. Lesion frequency.
Graph showing numbers of reported findings in both controls (pink) and patients with epilepsy when blinded (light blue), and unblinded (dark blue). Grey shaded rows show total numbers for a particular category of findings. Abbreviations: PVS-perivascular spaces; SWI–susceptibility weighted imaging.

