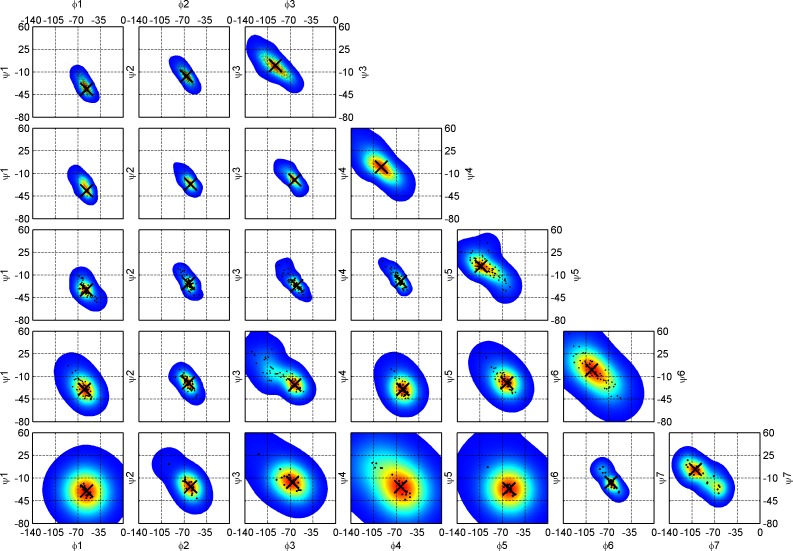
Fig 11. Ramachandran maps for 310 helices of increasing length, n from 3 (DSSP code GGG, top row) to 7 (GGGGGGG, bottom row).
Optimized kernel density estimates overlaid with (φ,ψ) sample scatter plots are drawn for each 310 helix residue starting from the first left position, 1 (first column) to the last right position, 7 (last column). Modes (peaks) for each 2D distribution are shown with a large black cross. The first (1) and last (n) residue conformations of 310 helices are A (-64°, -23°) and D (-92°, -1°) conformations respectively. The intervening residues are in between, sometimes with conformations spanning both populations. The exact values for (φ,ψ) modes of 310 helices are reported in Table 4.

