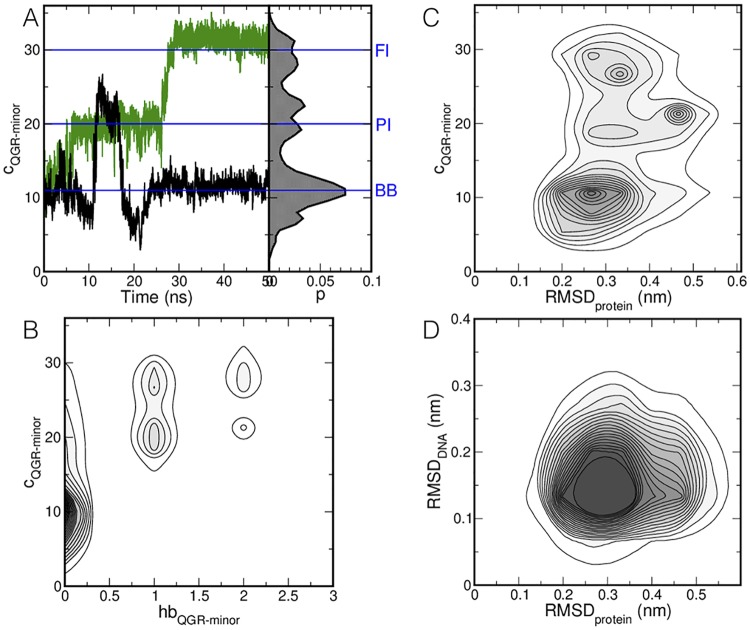
Fig 4. Results of the MD simulations.
(A) The number of contacts between the hydrogen bond donors in the QGR motif and hydrogen bond acceptors in the minor groove of the AT basepairs in the DNA cQGR−minor is plotted as a function of time for two representative runs (left), and given as a probability histogram over all MD simulations (right). (B) Probability density plot of the number of hydrogen bonds in the QGR motif and the minor groove of the AT basepairs and cQGR−minor. (C) Probability density as a function of the protein RMSD and cQGR−minor. (D) Probability density as a function of the protein RMSD and the DNA RMSD. Darker colors indicate a higher probability. Contour lines are drawn every 0.05%.

