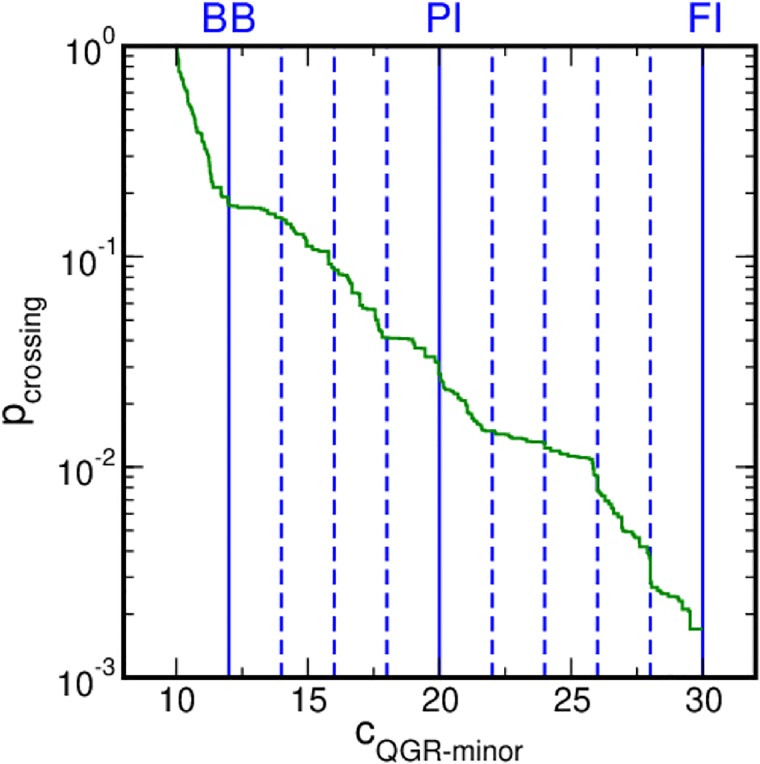
Fig 6. Crossing probabilities in the RETIS simulations.
The crossing probability is shown as a function of cQGR−minor in green. The profile quantifies the probability for a path starting from the BB state to reach a certain cQGR−minor value. The blue lines indicate the location of the interfaces. The solid lines indicate the location of the stable states.

