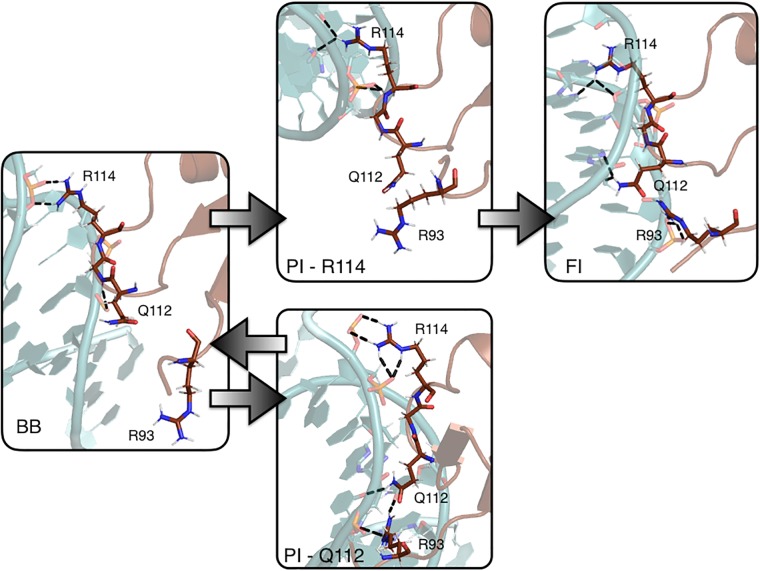
Fig 8. Mechanism of H-NS binding to AT-rich DNA.
Snapshots of the modes of interaction between H-NS and DNA. The protein (brown) and DNA (light blue) are shown in cartoon representation. The QGR motif and R93 are shown as sticks. The arrows indicate in which direction the transitions occurred in the RETIS simulations.

