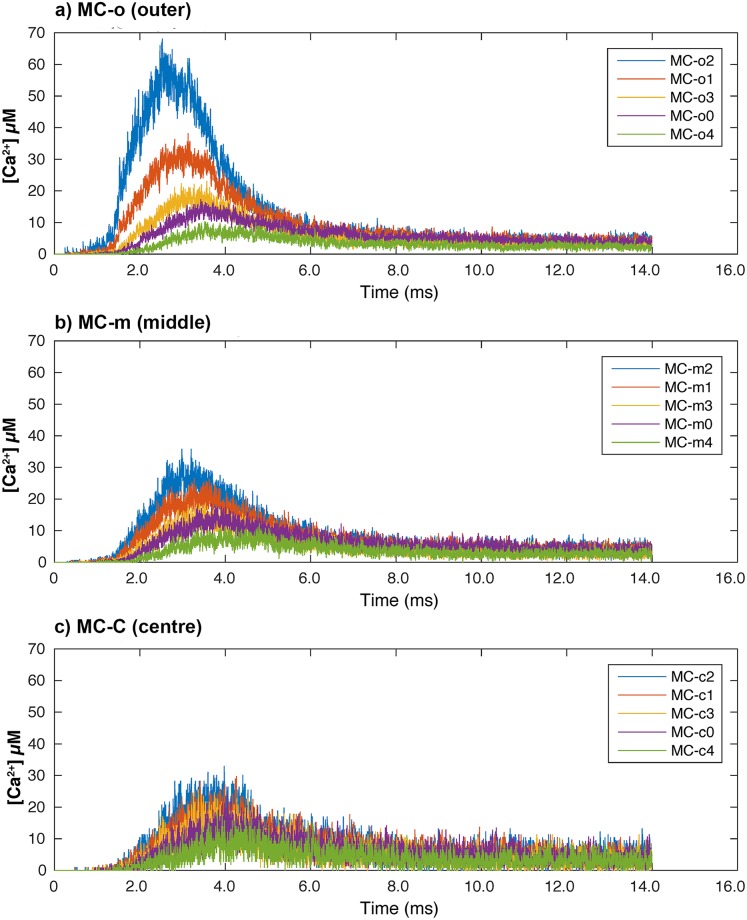
Fig 4. Calcium concentration along the sarcomere.
(a) Presents the 5 plots from MCs in the outer radial shell of the sarcomere model. (b) Presents the 5 plots from MCs in the middle radial shell of the sarcomere model. (c) Presents the 5 plots from MCs in the centre radial shell of the sarcomere model. Within the legend all results are sorted according to distance from the RYR’s to centre of each compartment.

