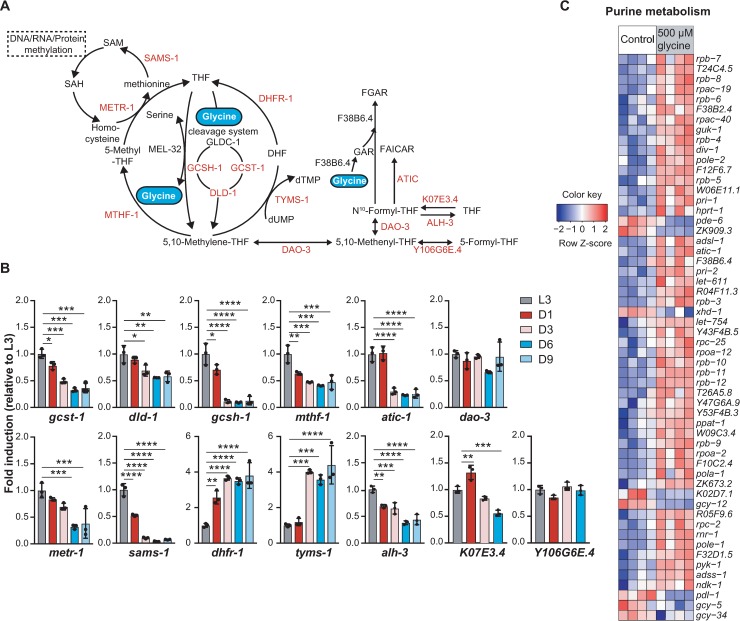
Fig 3. Glycine supplementation counteracts the age-induced suppression of gene expression in purine and one-carbon metabolism.
(A) Metabolic network of glycine metabolism feeding into one-carbon metabolism and de novo purine synthesis. Genes quantified by RT-qPCR and presented in the heat maps are highlighted in red. (B) The relative expression levels of the glycine metabolizing genes in worms from larval stage 3 (L3) to D9 adult. Worms were cultured on UV-killed E. coli OP50 and collected at the desired age. The expression level of the indicated gene was measured by RT-qPCR on total mRNA isolated from synchronized worms at every time point and compared to the mean in L3 worms. Mean ± SD. with three biological replicates; Significance was calculated using one-way ANOVA; *p < 0.5; **p < 0.01; ***p < 0.001; ****p < 0.0001; ns, not significant. (C) Heat map showing transcriptional profile of the differentially expressed genes in purine metabolism upon supplementation with 500 μM glycine (z-score normalized). Worms were cultured on UV-killed E. coli OP50 upon 500 μM glycine treatment from the time of hatching and then collected at adult D1 for total RNA extraction and RNA-sequencing analysis. An adjusted p-value < 0.05 was set as the cut-off for significantly differential expression.

