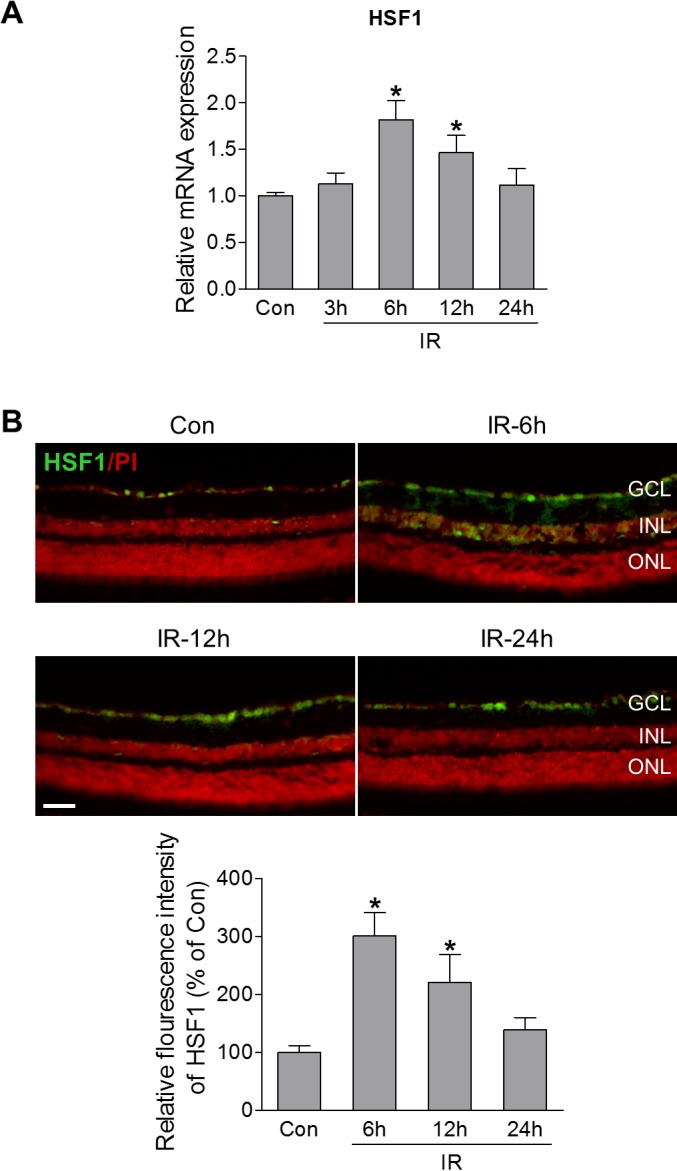
Figure 1.

HSF1 expression is increased following retinal ischemia-reperfusion injury. WT mice were subjected to IR, and retinas or eyeballs were collected at various times after IR. (A) Quantitative PCR (qPCR) analysis of HSF1 mRNA expression in noninjured control retinas (Con) or injured retinas at 3, 6, 12, and 24 hours after IR. (B) Representative images of HSF1 immunostaining (green) in retinal frozen sections from control and injured-eyes at 6, 12, and 24 hours after IR. Red is PI staining. Bar graph represents quantification of immunoreactivity of HSF1 protein. N = 3 to 4 mice; *P < 0.05 versus control. Scale bar: 50 μm. ONL, outer nuclear layer.
