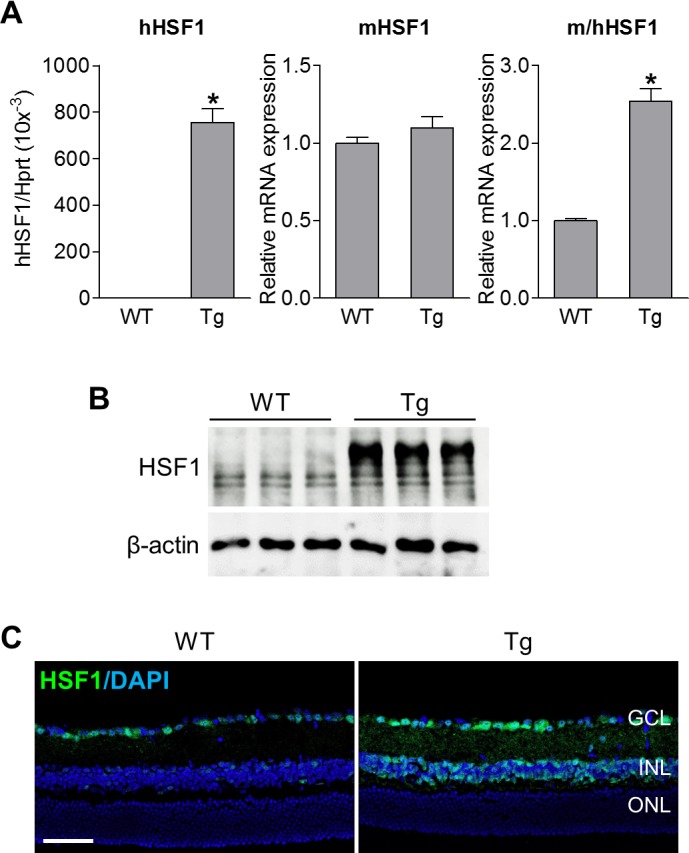
Figure 2.

Confirmation of HSF1 overexpression in the retina of HSF1-Tg mice. Retinas or eyeballs were collected from WT and HSF-Tg mice. (A) Quantitative PCR analysis for mRNA expression of human HSF1 (hHSF1), murine HSF1 (mHSF1) or both (m/hHSF1). (B) HSF1 protein expression by Western blot analysis. Multiple HSF1 bands were observed in retinal lysates since mouse HSF1 splice variants encode proteins of different lengths. (C) Representative images of retinal sections labeled with HSF1 antibody (green). Blue is DAPI staining. Scale bar: 50 μm.
