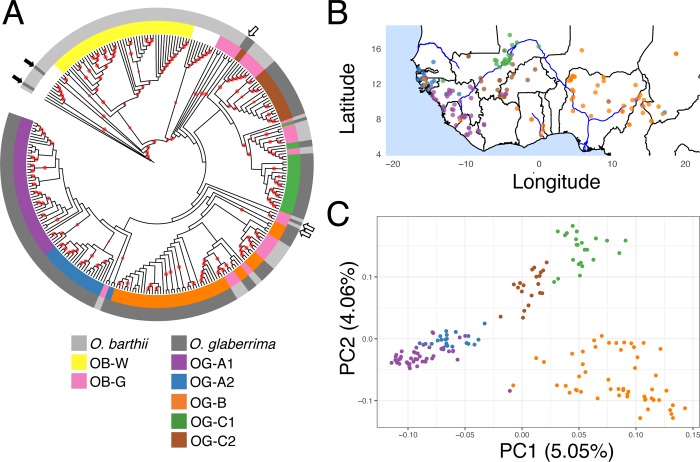
Fig 3. Phylogenomic and principal component analysis of African rice.
(A) Neighbor-joining tree built using a distance matrix estimated from NGSdist. Color strips represent group of O. glaberrima individuals sharing a common ancestor. Internal branches with red circle denote bootstrap support of greater then 80%. Dark arrows indicates the O. glaberrima grouping with divergent O. barthii groups, and white arrows indicates the O. glaberrima grouping with OB-G group O. barthii. (B) Geographical distribution of each individual and colored by its grouping status as outlined in (A). (C) Principal component analysis conducted using NGScovar. Individuals are color coded according to (A).

