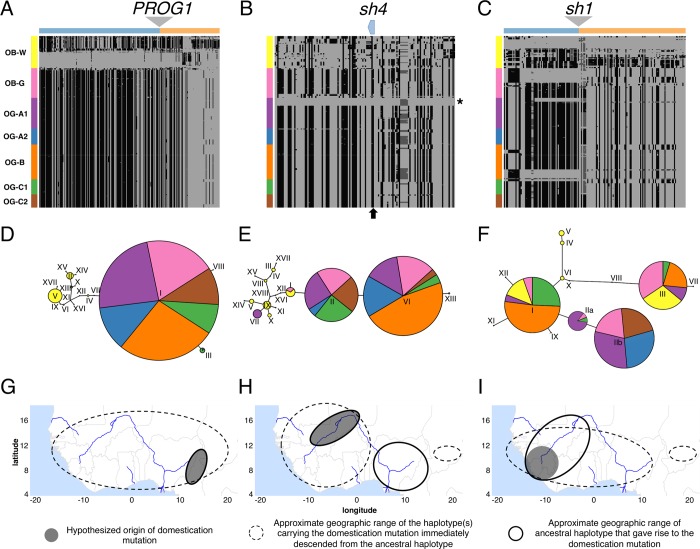
Fig 6.
Haplotype analysis of the three domestication genes (A,D,G) PROG1, (B,E,H) sh4, and (C,F,I) sh1. Haplotype structures are shown for the genes (A) PROG1, (B) sh4, and (C) sh1. Homozygote genotype not identical to reference genome is shown in dark grey, heterozygote genotype shown in lighter shade of grey, and homozygote genotype identical to reference genome shown in lightest shade of grey. Regions are showing polymorphic sites from 25 kbp up- and downstream of the domestication gene. In sh4 (B) the position of the causal domestication mutation is shown in arrow and OG-A1 samples without the causal mutation are indicated with a star. In PROG1 (A) and sh1 (C) region upstream and downstream the deletion are color coded above the haplotype structure. Haplotype network are shown for genes (D) PROG1, (E) sh4, and (F) sh1. Approximate geographic origins for the causal domestication mutation haplotype and its most closely related ancestral haplotype are shown for genes (G) PROG1, (H) sh4, and (I) sh1. See text for discussion of the hypothesized geographic origins.

