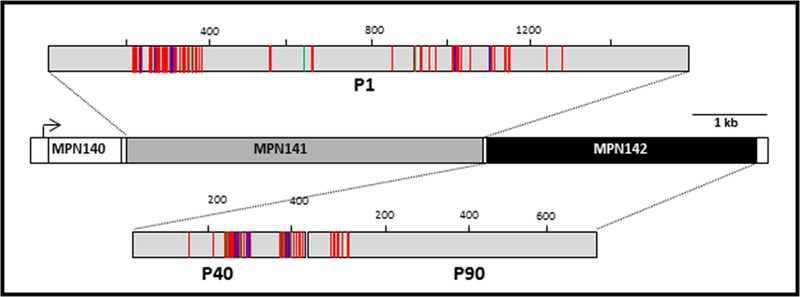
Figure 1.

Schematic representation of amino acid sequence variability in M. pneumoniae proteins P1 and P40/90 between the genotype 1 reference strain M129 and the genotype 2 reference strain FH. P1 and P40/P90 are the products of MPN141 and MPN142, respectively. Red green, and blue lines indicate amino acid substitutions, insertions, and deletions, respectively, in FH relative to M129.
