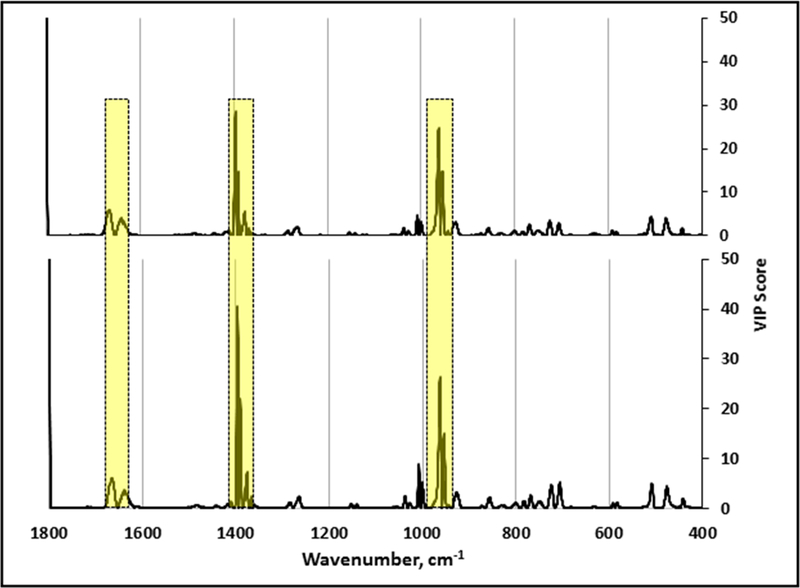
Figure 2.

VIP analysis of PLS-DA models that discriminate diverse clinical isolates relative to the genotype 1 reference strain M129 (upper; n= 195 spectra) or the genotype 2 reference strain FH (lower; n=175 spectra). Regions highlighted by yellow boxes indicate major discriminating Raman band wavenumbers. The band at wavenumber 1800 cm-1 was variable in mycoplasma samples and growth medium controls and is likely a function of sample preparation. As there are no known biomolecules assigned to this wavenumber, this band was not considered further here.
