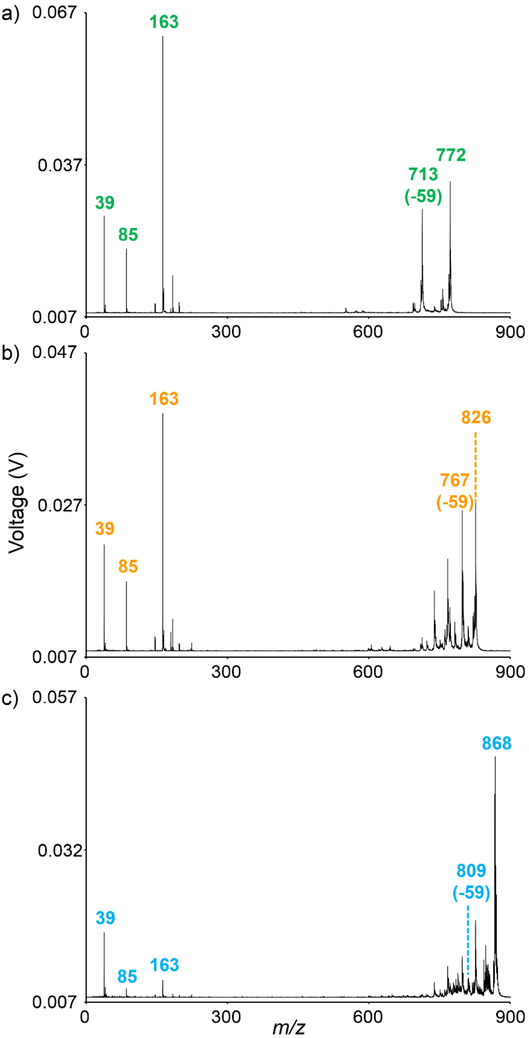
Figure 3:
MS/MS analyses of (a) m/z 772.5, (b) m/z 826.5, and (c) m/z 868.5 allows for the identification of these lipids as [PC(32:0)+K]+, [PC(36:1)+K]+, and [PC(40:8)+K]+, respectively. MALDI TOF/TOF fragmentation was performed using PSD. Displayed mass spectra represent averages of ~20,000 MALDI laser shots acquired from rat brain tissue.

