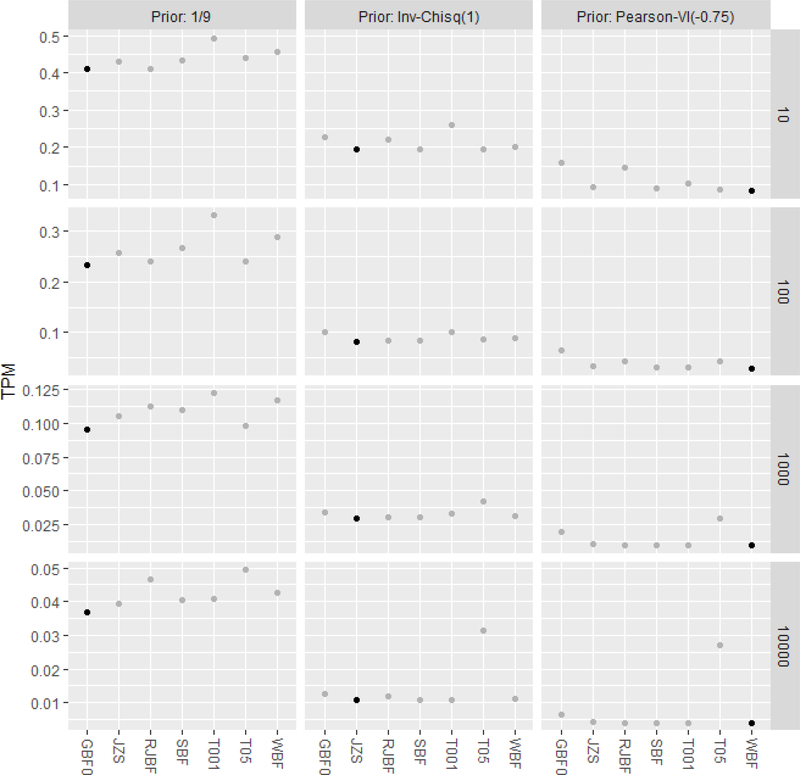
Figure 1.
Total probability of misclassification as function of nδ (rows 10, 100, 1,000, 10,000) under the three different prior settings for (columns = 1/9, ∼ Inv-, ∼ Pearson-VI (−0.75)). The points indicating minimum TPM are highlighted in black, all others are grey. The BF that uses the prior corresponding to the true model has minimum TPM. The ordinary t test using α = (0.001, 0.05) is shown as (T001, T05).

