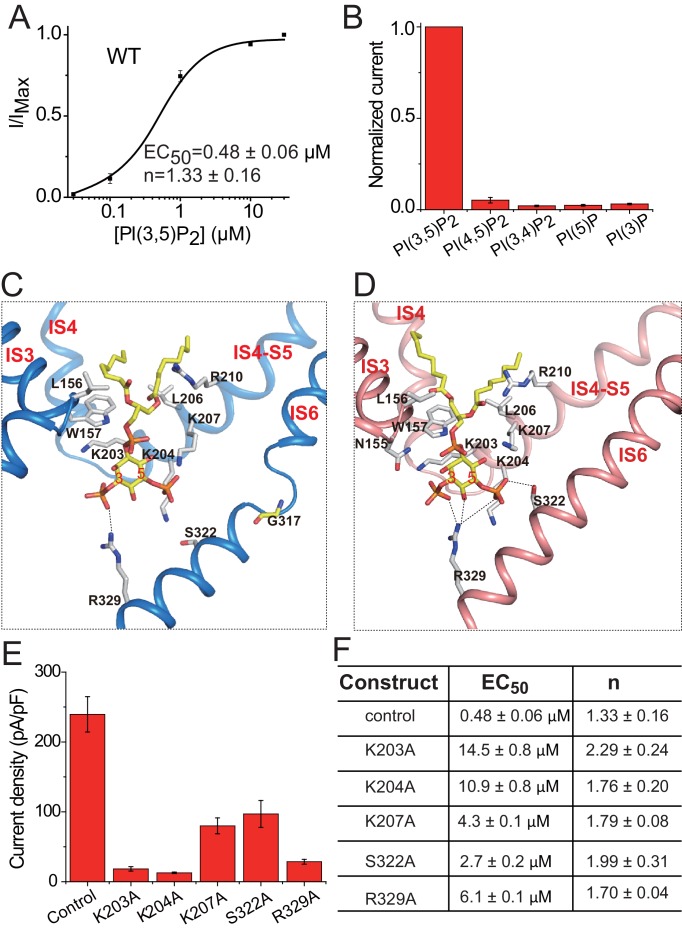
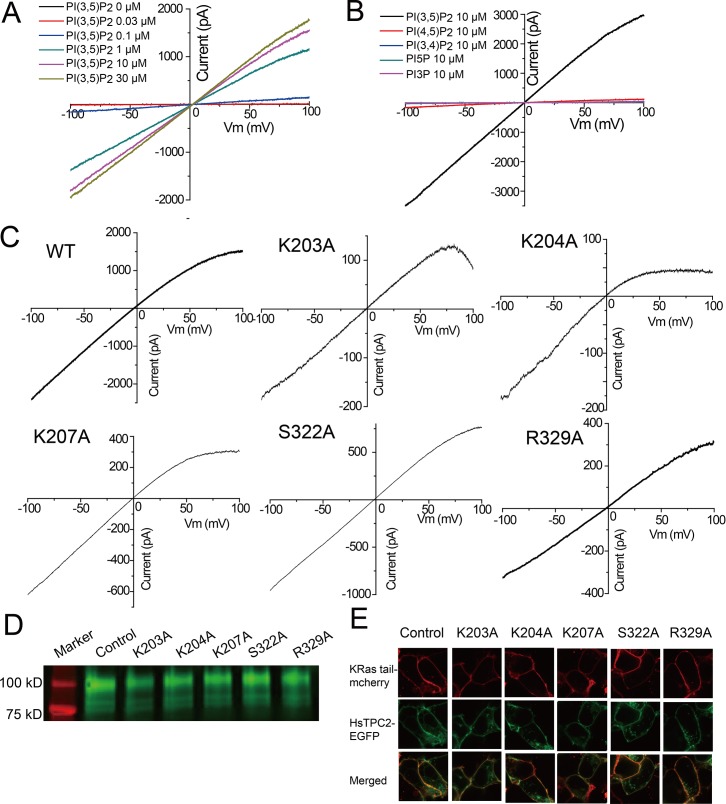
Figure 4. PI(3,5)P2 binding in HsTPC2.
(A) Concentration-dependent PI(3,5)P2 activation of HsTPC2 at −100 mV. Curves are least square fits to the Hill equation. Data points are mean ± s.e.m. (n = 5 independent experiments). (B) Ligand specificity of HsTPC2. Normalized currents of HsTPC2 measured at −100 mV in inside-out patches with the presence of various phosphatidylinositol lipids at 10 µM. (C and D) Ligand binding site in 6-TM I of HsTPC2 both in the PI(3,5)P2-bound closed (C) and open (D) states. (E) Current density of mutations at the PI(3,5)P2-binding site measured at −100 mV by whole cell recordings with 100 µM PI(3,5)P2. All mutants were generated on the background of the Leu11Ala/Leu12Ala mutant, which was used as the wild-type control. Data in (B) and (E) are shown as mean ±s.e.m. (n ≥ 6 independent experiments). (F) Measured EC50 and Hill coefficient values for the mutants. Data are mean ±s.e.m. (n ≥ 5 independent experiments). Source data for Figure 4A,B,E and F are available in Figure 4—source data 1.


