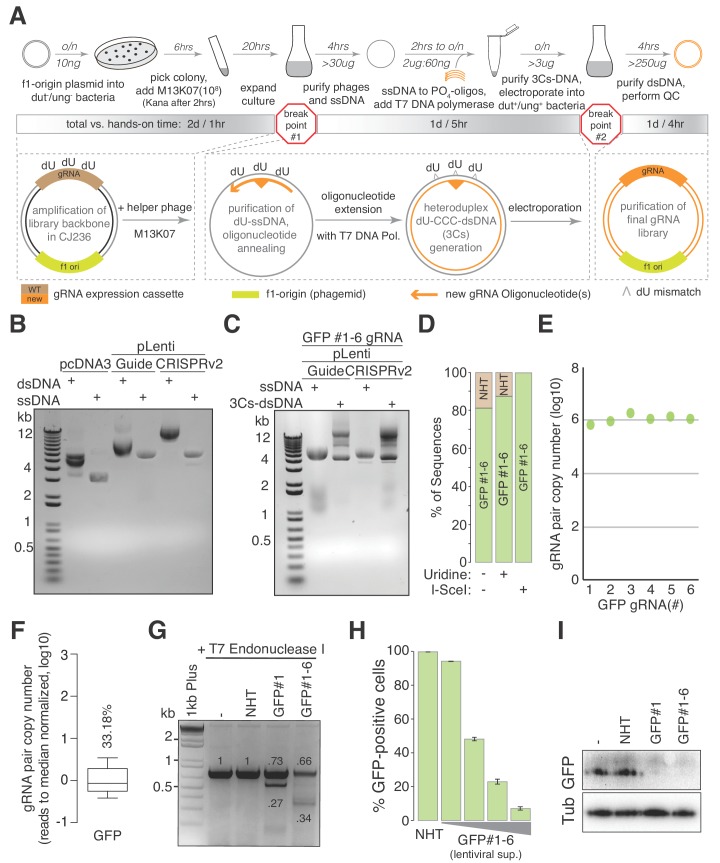
Figure 1. The 3Cs technology - covalently-closed-circular-synthesized (3Cs) CRISPR/Cas gRNA reagents.
(A) The general 3Cs workflow. The individual steps of the protocol (grey arrows), time requirements (on top of arrow) and used or expected DNA yields (below arrow) are highlighted. Time requirements are separated by total versus hands-on time (grey scaled bars). Please note that the protocol contains two possible break points (red stop signs) at which purified phages can be stored at 4°C (break point #1) or bacterial pellets/purified plasmid DNA can be stored at −20°C (break point #2). In more detail, f1-origin containing double-stranded CRISPR/Cas plasmids are converted to dU-containing circular ssDNA. Guide RNA sequence (orange triangle) containing oligonucleotides (orange arrows) are annealed to ssDNA, and extended and ligated by T7 DNA polymerase and T4 ligase, respectively. Heteroduplex dU-3Cs-DNA is transformed into base-excision-repair-sufficient bacteria to deplete template DNA (grey strand) and to amplify the newly synthesized DNA (orange) selectively. (B) Lentiviral CRISPR/Cas plasmids (pLentiGuide, pLentiCRISPRv2) and the mammalian cDNA expression plasmid pcDNA3 (positive control) were converted to dU-containing circular ssDNA and analyzed by gel electrophoresis. Although identical in size, circular ssDNA appears as a single band and migrates faster than the corresponding dsDNA form. (C) The lentiviral circular ssDNA of panel (B) was annealed with a pool of six oligonucleotides, encoding six GFP-targeting gRNAs, to generate a pool of 3Cs-dsDNA and analyzed by gel electrophoresis. A successful 3Cs in vitro reaction is indicated by three distinct 3Cs-dsDNA product bands (Huang et al., 2012). (D) Bar graph showing the degree of template remnants in the final 3Cs products in the presence and absence of additional Uridine in the phage culture medium as well as an I-SceI clean-up step. The gRNA libraries from panel (C) were sequenced by NGS before and after I-SceI restriction enzyme digest. Although the effect of Uridine is marginal, an enzymatic digest with I-SceI removes template plasmid remnants. (E, F) gRNA distribution displayed as raw read count data points (E) and normalized values in box plot format (F). The coefficient of variation was calculated by dividing the standard deviation by the mean of the library’s read counts and is displayed as percentage above the box plot (F). Data were derived from the NGS data shown in panel (D). The final GFP-targeting 3Cs-gRNA library is free of sequence bias, as demonstrated by the low coefficient of variation of 33.18%, and by the uniform sequence distribution ((E), also see Figure 1—figure supplement 1H). (G) GFP-expressing hTERT–RPE1 cells were transduced with lentiviral 3Cs-gRNA constructs (non-targeting control gRNA (non-human target sequences (NHT)), a single GFP-targeting 3Cs-gRNA (GFP#1) or a pool of six GFP-targeting 3Cs-gRNAs (GFP#1–6)), and selected with puromycin before GFP gene editing was analyzed by T7 endonuclease I assay (Guschin et al., 2010). Individual band intensities were quantified (black numbers). An empty control (–) served as the reference. (H) A dose-dependent reduction of GFP fluorescence was determined by the flow cytometry of GFP-expressing hTERT–RPE1 cells and transduced with increasing volumes of lentiviral supernatant containing a pool of six GFP-targeting 3Cs-gRNAs (GFP#1–6). Error bars represent standard deviations (SDs) over three biological replicates (n = 3). (I) Immunoblot analysis of hTERT–REP1 cells treated as in panel (G) demonstrates that GFP-targeting 3Cs-gRNAs induce a 3- to 4-fold reduction in total GFP protein levels over three biological replicates (n = 3, for quantification see also Figure 1—figure supplement 1I).


