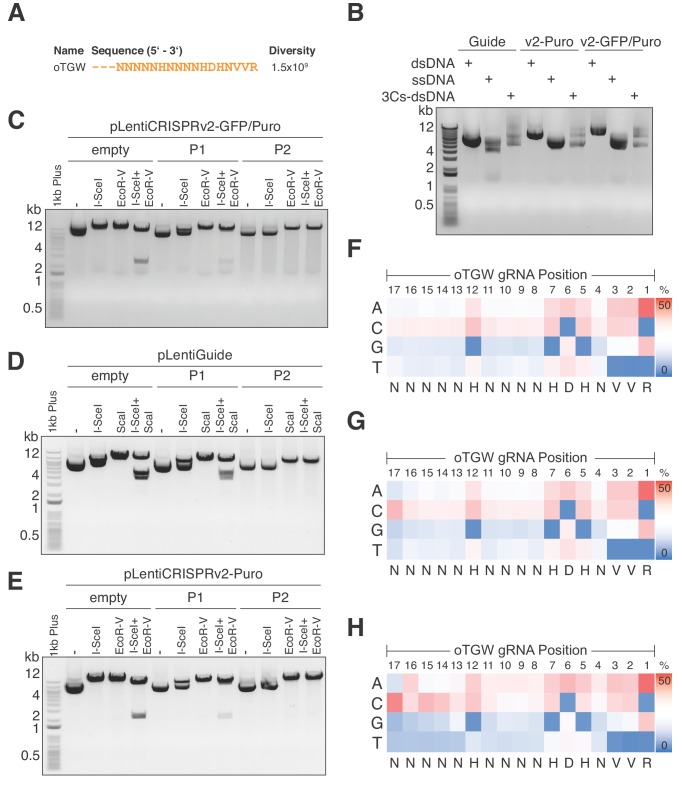
Figure 6. Optimized TGW (oTGW) libraries for functional interrogations in the coding and noncoding genome.
(A) oTGW oligonucleotide sequence, based on reported SpCas9 nucleotide preferences. The truncation of three 5′ nucleotides results in 17-mer gRNAs with a total oligonucleotide diversity of 1.5 × 10⁹. (B) oTGW 3Cs-dsDNA was synthesized on a ssDNA-template of pLentiGuide, pLentiCRISPRv2-Puro and pLentiCRISPRv2-GFP/Puro. 3Cs products are analyzed by gel electrophoresis on a 0.8% TAE/agarose gel. (C–E) Removal of template plasmid remnants with an I-SceI restriction enzyme digest. oTGW 3Cs-dsDNA was electroporated with efficiencies above 6.31 × 10⁹ and amplified for DNA purification (P1). A subsequent I-SceI restriction enzyme digest and an electroporation of P1 yielded the final 3Cs libraries containing no detectable template plasmid (P2). An analytical restriction enzyme digest with I-SceI and EcoRV removes a 2.5-kb DNA fragment from the template plasmid (empty) and to a minor degree from P1 DNA pools. No 2.5-kb fragment could be observed in the final P2 DNA library pools, demonstrating the high purity of the final libraries (see also Figure 6—figure supplement 1). (F–H) High-throughput sequencing data derived from panels (C–E) were used to compute the nucleotide frequency of each gRNA nucleotide position, which are visualized as heat maps. The identified nucleotide frequencies closely resemble the pattern of the degenerated oTGW oligonucleotide shown in panel (A). Color coding illustrates the nucleotide frequencies (0% in blue to 50% in red).


